
Intern - US Equities
Status
Intern at
Group/Division/Type
Investment Management
City
Seattle
Interviewed
April 2018
Overall experience
Difficulty
General Interview Information
Outcome
No Offer
Interview Source
Employee Referral
Length of Process
1-2 months
Interview Details
What did the interview consist of?
Phone Interview
Please describe the interview / hiring process.
The hiring process consisted of multiple phone screens. I had reached out to an alumni who worked at the firm and he forwarded my profile to the recruiter to view.
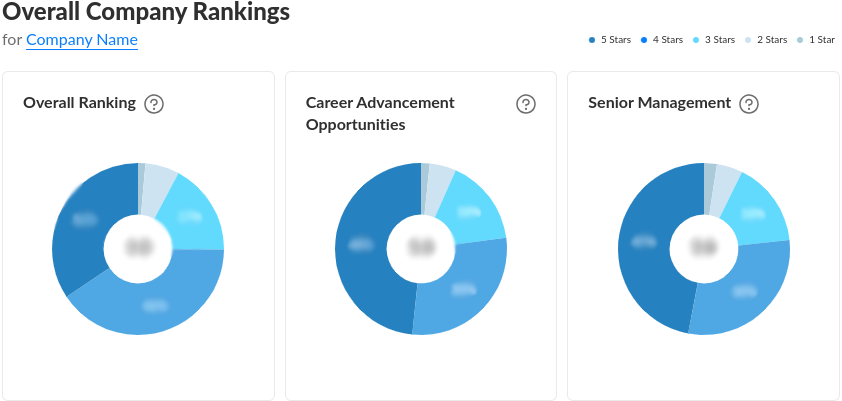
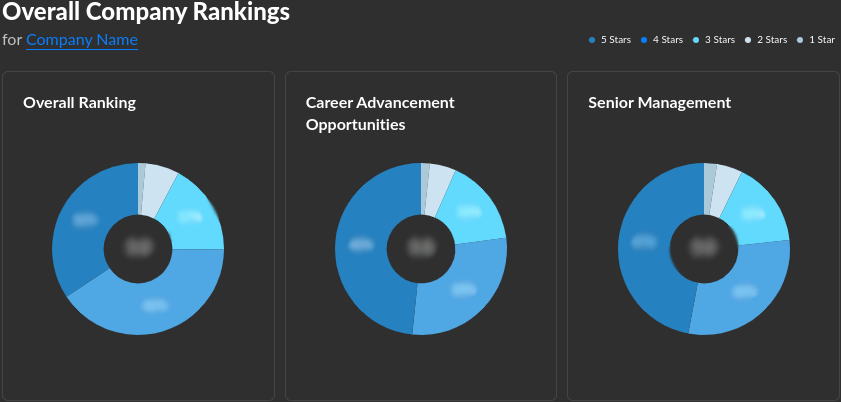
Want Access to these Russell Investments Overall Company Rankings?
- Free 1 month access by adding just 1 salary datapoint here
- REAL salary bonus data across 1,000+ companies
- Plus free 1 month access to 10,000+ interview insights
Was this interview insight helpful?
How many stars would you give to this interview insight?


or Want to Sign up with your social account?