Quantitative Trader Internship

Status
Intern at
Group/Division/Type
Prop Trading
City
Chicago, IL, USA
Interviewed
October 2019
Overall experience
Positive
Difficulty
Easy

General Interview Information

Outcome
No Offer
Interview Source
College / University / On Campus Recruiting
Length of Process
Less than 1 month

Interview Details

What did the interview consist of?
Phone Interview
1 on 1 Interview
Please describe the interview / hiring process.
First received a coding challenge that consisted of some simple coding exercises. Next had 2 phone interviews. One was with a trader and was technical consistently of questions varying from option theory, coding, data science, probability, and a brain teaser at the end. The other was talking with a data scientist about previous work experience and some technical questions on data science.
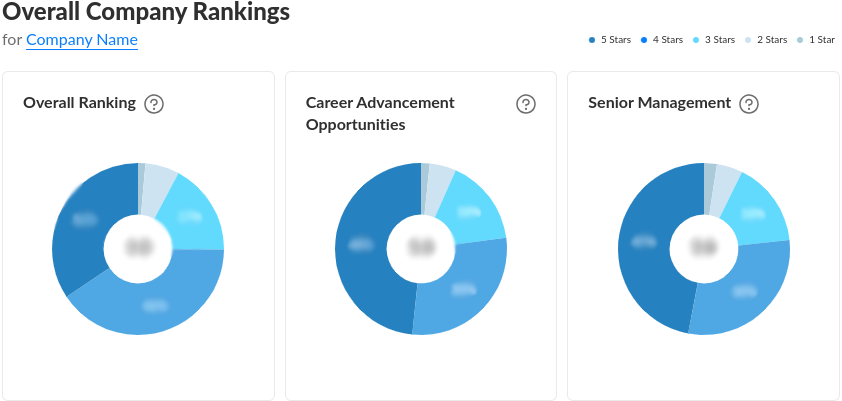
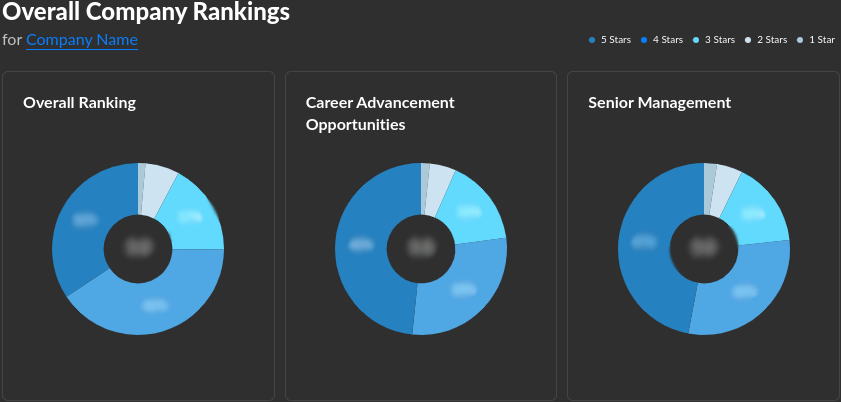
What were the most difficult or unexpected interview questions asked?
They asked some strange questions about coding I did not expect. They asked what the difference between static and dynamic programming languages were and I did not know. They also asked about Big O notation. They also asked about pricing options given an ask and a bid price for options with different strikes if you were to short one and long another. I was also asked a brain teaser about the hat problem where 3 people go into a room with I think 3 red and 2 blue hats. I was also asked about some assumptions of the Black Scholes model and also OLS when I was doing the interview with the data scientist.
How did you answer each of these questions (please be specific)?
I had to skip some of the coding questions, but the Big O, I just explained how it described how the time it takes to process a function scales accordingly to the time complexity. For the pricing options question, I calculated the bid ask spread between the two options with the different strikes and subtracted one from the other. For the brain teaser, I logically went through each statement. The first was that the man did not know the color of his hat, then you use that to deduce the other three are not the same color, and you continue that for the second man who also did not know the color of his hat and can deduce what the third man is wearing.

Overall Company Rankings

  • 5 Stars
  • 4 Stars
  • 3 Stars
  • 2 Stars
  • 1 Star
Overall Ranking

Overall Ranking is a score from 1 star (very bad) to 5 stars (excellent) generated based on the Company Reviews of current and former employees at this company, taking everything into account.

The number you see in the middle of the donut pie chart is the simple average of these scores. If you hover over the various sections of the donut, you will see the % breakdown of each score given.

The percentile score in the title is calculated across the entire Company Database and uses an adjusted score based on Bayesian Estimates (to account for companies that have few reviews). Simply put, as a company gets more reviews, the confidence of a "true score" increases so it is pulled closer to its simple average and away from the average of the entire dataset.

4.6
Career Advancement Opportunities

Career Advancement Opportunities is a score from 1 star (very bad) to 5 stars (excellent) generated based on the Company Reviews of current and former employees at this company, taking everything into account.

The number you see in the middle of the donut pie chart is the simple average of these scores. If you hover over the various sections of the donut, you will see the % breakdown of each score given.

The percentile score in the title is calculated across the entire Company Database and uses an adjusted score based on Bayesian Estimates (to account for companies that have few reviews). Simply put, as a company gets more reviews, the confidence of a "true score" increases so it is pulled closer to its simple average and away from the average of the entire dataset.

4.6
Senior Management

Senior Management is a score from 1 star (very bad) to 5 stars (excellent) generated based on the Company Reviews of current and former employees at this company, taking everything into account.

The number you see in the middle of the donut pie chart is the simple average of these scores. If you hover over the various sections of the donut, you will see the % breakdown of each score given.

The percentile score in the title is calculated across the entire Company Database and uses an adjusted score based on Bayesian Estimates (to account for companies that have few reviews). Simply put, as a company gets more reviews, the confidence of a "true score" increases so it is pulled closer to its simple average and away from the average of the entire dataset.

4.4

Was this interview insight helpful?

How many stars would you give to this interview insight?

No votes have been submitted yet.

video
Break into Goldman Sachs
WSO Academy helps place students in Elite Firms around the world
$50m+
Est Annual Revenue

Other Interview Data

Associate (Vice President)
Goldman Sachs, CHICAGO, 2016
Trader (Vice President)
HSBC, New York, 2022
Vp (Vice President)
Morgan Stanley, New York, 2021
Vp (Vice President)
Morgan Stanley, New York, 2021
Quantitative Strategist (Vice President)
Morgan Stanley, NA, 2020

Extend Your Access

Add your own interview and get 1 month free