Fibonacci Numbers
Fibonacci sequence is used in technical analysis to determine levels of support and resistance


What are Fibonacci Numbers?
Fibonacci numbers (also called as Fibonacci series or Fibonacci sequence) is a set of numbers, wherein, after the first two numbers (0 and 1), every number is equal to the sum of the two preceding numbers. The Fibonacci series looks something like this:
0, 1, 1, 2, 3, 5, 8, 13, 21, 34, 55, 89, 144, 233, 377, 610…
Notice how every number of the series is the sum of the preceding two numbers. For instance, the third number is 1, which is equal to 0+1 (the total of the first two numbers), and the fourth number, 2, is equal to 1+1 (the sum of the second and the third term). Furthermore, notice that:
610 = 377 + 233
377 = 233 + 144
233 = 144 + 89
144 = 89 + 55, and so on
The Fibonacci series goes on indefinitely and has many important properties and applications in mathematics, science, and nature.
The Fibonacci numbers were first mentioned in Indian mathematics as early as 200 BC in a work by Pingala, an Indian poet and mathematician.
The Fibonacci series is named after Leonardo of Pisa, who was also known as Fibonacci. Fibonacci introduced this sequence to the Western world through Liber Abaci, a book he published in 1202.
Liber Abaci, which means ‘Book of Calculation,’ was one of the most important mathematical texts of the Middle Ages and introduced many new concepts to the Western world, including the Fibonacci sequence.
- The Fibonacci series is a sequence of numerals wherein every numeral equals the sum of the previous two numerals.
- The Fibonacci series looks something like this: 0, 1, 1, 2, 3, 5, 8, 13, 21, 34, 55, 89, 144, 233, 377, 610…
- The ratio of 1.618 is considered the Golden Ratio, also referred to as the Phi.
- Fibonacci numbers find plenty of applications in the stock market. Tools like Fibonacci retracements, time zones, speed resistance arcs, and Fibonacci circles are all fundamentally based on the Fibonacci sequence.
- Using Fibonacci-based trading tools solely cannot ensure success. Before making any trading choices, these tools should be utilized in conjunction with additional technical and fundamental variables.
What makes the Fibonacci sequence unique?
Fibonacci numbers are a special sequence of numbers in mathematics with many interesting and unique properties. There are several reasons why Fibonacci numbers are considered special.
Here are a few interesting properties of Fibonacci numbers:
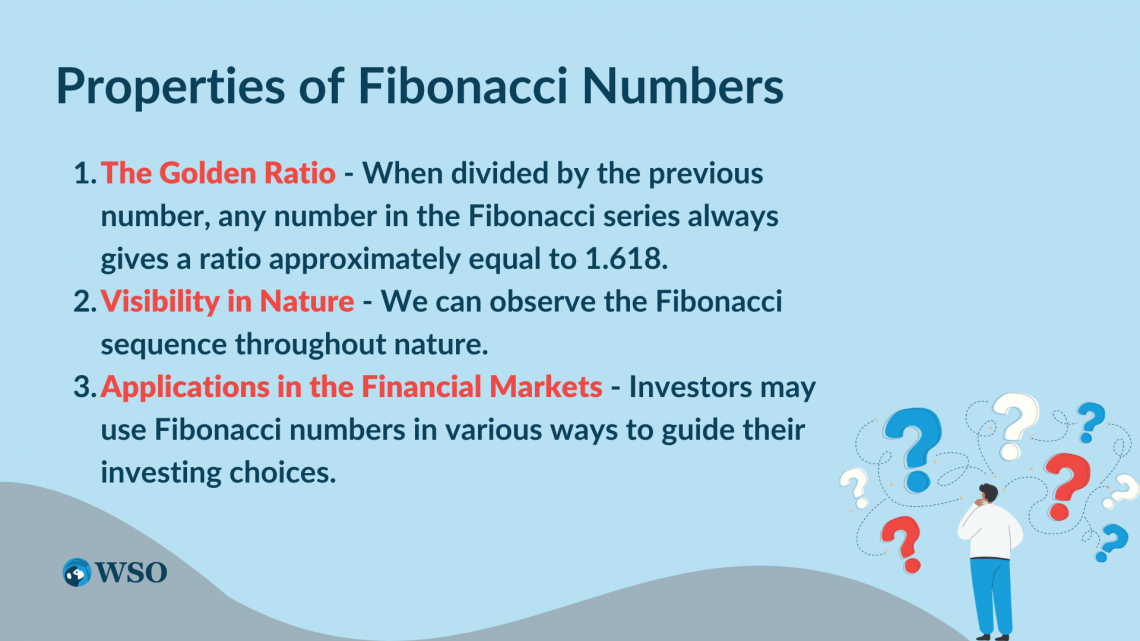
1. The Golden Ratio
When divided by the previous number, any number in the Fibonacci series always gives a ratio approximately equal to 1.618.
For example:
610/377 = 1.618
377/233 = 1.618
233/144 = 1.618
The ratio of 1.618 is considered the Golden Ratio, also called the Phi.
The golden ratio can be observed in various natural phenomena, including flower petals, animal bodies, fruits, rock formations, and galaxy formations.
When any number in the Fibonacci sequence is divided by a number two places higher or by any number three places higher, a similar consistency is observed.
Every time the ratio is divided by a number two places higher, the result is around 0.382. As an illustration, the ratios 13/34, 21/55, 34/89, and so forth all equal 0.382.
Similarly, the ratio is usually around 0.236 when a number in the Fibonacci sequence is divided by a number three places higher. For instance, 13/55, 21/89, 34/144, 55/233, and so on all equal 0.236.
2. Visibility in Nature
We can observe the Fibonacci sequence throughout nature. For instance, the Fibonacci sequence is frequently found in the number of petals on flowers. Daisies, for instance, have 34, 55, or 89 petals, which are all numbers in the series.
Note
The spirals in pinecones and pineapples also follow the Fibonacci sequence. The number of spirals going in one direction is often a Fibonacci number, and the number of spirals going in the other direction is often a consecutive Fibonacci number.
Another intriguing observation could be that the dimensions of the human body and those of many other creatures also follow the golden ratio. For instance, the proportion of the forearm's length to the hand's length is around 1.618.
These are only a handful of the numerous instances of the golden ratio and the Fibonacci sequence in the natural world. They depict the astounding beauty and complexity of the natural world and how science and math may aid in our comprehension and appreciation of it.
3. Applications in the Financial Markets
Fibonacci numbers may be used in a variety of ways by investors to guide their investing choices.
The Fibonacci ratios, i.e.: 61.8%, 38.2%, and 23.6%, have applications in the financial markets. Investors often use trading tools that are based on Fibonacci numbers. Some of these are Fibonacci extensions, retracements, and time zones.
These trading tools can help investors identify potential support and resistance levels, set profit targets, time trades, and analyze trends.
Applications of Fibonacci Numbers in the Stock Market
Fibonacci numbers find plenty of applications in the stock market. Several technical techniques often employed in financial research and trading are based on the Fibonacci sequence.
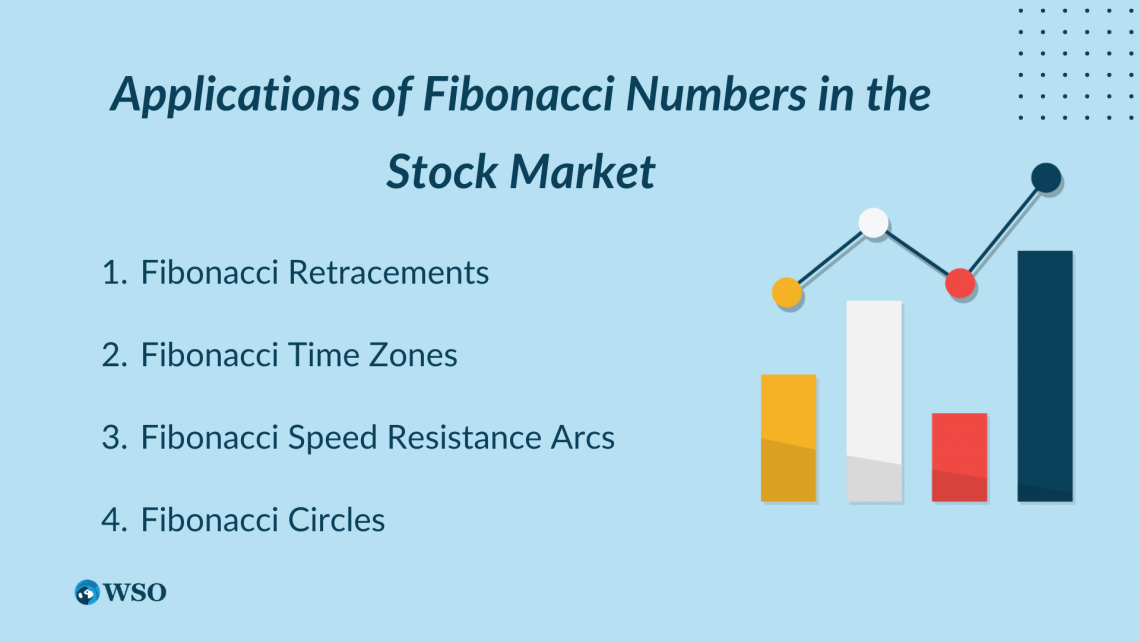
Some of them are:
1. Fibonacci Retracements
Fibonacci retracements are horizontal lines representing possible support and resistance levels on a price chart based on the Fibonacci sequence.
The Fibonacci ratios of 0.618 (61.8 %), 0.382 (38.2%), and 0.236 (23.6%) find their application in the share markets. Along with these ratios, an additional component of 50% is added to the retracement levels.
These levels are created by choosing a high and a low point on a price chart and then drawing horizontal lines at the Fibonacci levels. Below is a representation of Fibonacci retracements.
Traders use these levels to pinpoint probable zones of support and resistance. An asset's price may find support at a Fibonacci retracement level if it drops to it and then rises again. On the other hand, a Fibonacci level may serve as resistance if the price climbs to it before falling back down.
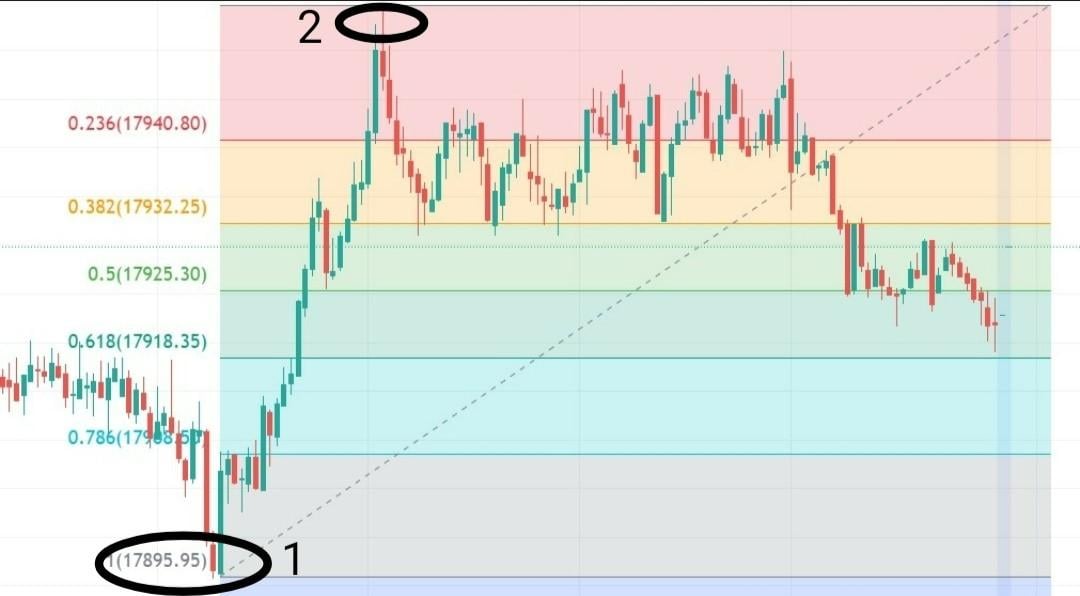
A Fibonacci retracement has been made in the chart above by joining the peak of one trend with the peak of the same trend (represented by points 1 and 2, respectively). Support and resistance levels are drawn at 0.618, 0.5, 0.382, and 0.236.
In the above example, we can see that the index takes support at 17932 (0.382) on multiple occasions, takes support at 17925 (0.5) twice, and once at 17918 (0.618).
2. Fibonacci Time Zones
Fibonacci Time Zone is a technical analysis tool that comprises a group of vertical lines that run parallel to the horizontal axis (which represents time).
Fibonacci time zones point up prospective time-related areas of relevance without considering the price. By tracing a trend line between price highs or lows, the determination of a base interval is done. After that, the Fibonacci Time Zone tool plots a sequence of vertical lines with progressively greater spacing.
These time zones follow the Fibonacci sequence. Each vertical line is spaced so that the sequence followed by the distances between two consecutive vertical lines is in the Fibonacci sequence.
For instance, in a Fibonacci time zone, the 6th zone = 8 periods, 7th zone = 13 periods, 8th zone = 21 periods, 9th zone = 34 periods, 10th zone = 55 periods, and so on...
Note
At the start of the chart, the initial few Fibonacci numbers produce a series of quite a few narrow Fibonacci Time Zones. As a result, it could be essential to disregard the initial few zones. Following the initial few zones, the zones soon spread out and provide the sequence some breathing room.
The Fibonacci Time Zone tool's main purpose is to predict or foresee probable reversals depending on the time that has passed. Precisely, the probable points of reversal may lie at 13, 23, 34, 55, 89, or 144 days ahead.
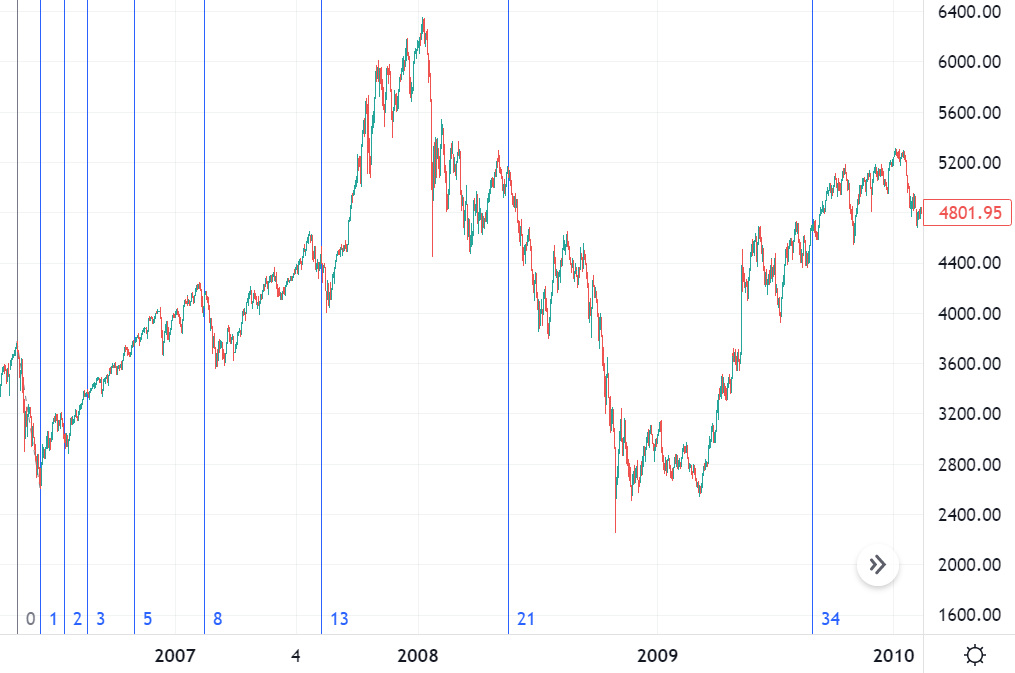
We picked a trend (region 0-1) in the image above. From there on, the tool marks points of possible reversals on the chart.
As mentioned above, the first few vertical lines don’t predict reversal points accurately. However, the lines denoted by the numbers 21 and 34 mark a reversal point for the underlying price.
3. Fibonacci Speed Resistance Arcs
Fibonacci Speed Resistance Arcs are employed in technical analysis to show the support and resistance levels and the direction and pace of trend reversals.
To draw Fibonacci speed resistance arcs on a chart, traders start by identifying a significant high or low on the chart. They then draw a trendline at that price level.
Next, the tool will draw a series of arcs around the line, with the radii of the arcs determined by Fibonacci ratios. The arcs can then be used to identify potential support and resistance levels.
These levels can be used to set entry and exit points for trades and place stop-loss and take-profit orders.
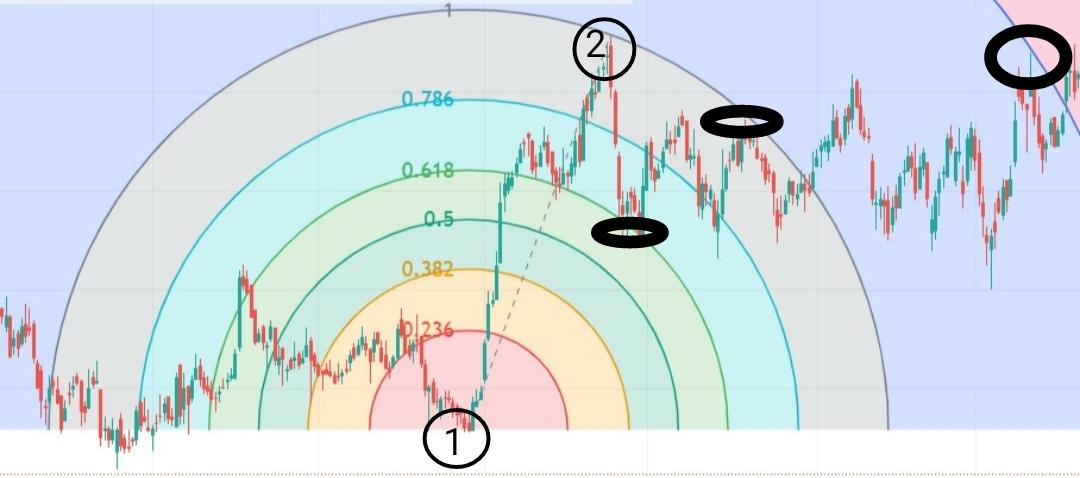
In the image above, you can see that we connect a high and a low (represented by points 1 and 2, respectively) to a long-running trend. The tool draws arcs that are separated by distances determined by the Fibonacci sequence.
The encircled points show the various points where the underlying takes to support or shows resistance when it touches or comes nearby the arcs.
4. Fibonacci Circles
Fibonacci circles are technical analysis tools that can be used to identify potential levels of support and resistance in a stock's price movement over time.
These are created by drawing a circle around a significant price point on a stock's chart and then drawing additional circles at specific intervals based on the Fibonacci sequence.
Once the circles are drawn, they can be used to identify potential levels of support and resistance in the stock's price movement. The circles act as visual guides, with the outer circles representing potential support and resistance levels.
Traders and analysts use Fibonacci circles to identify potential trade entry and exit points. If the stock's price is approaching a Fibonacci circle, traders may consider buying or selling depending on whether the circle represents a potential level of support or resistance.
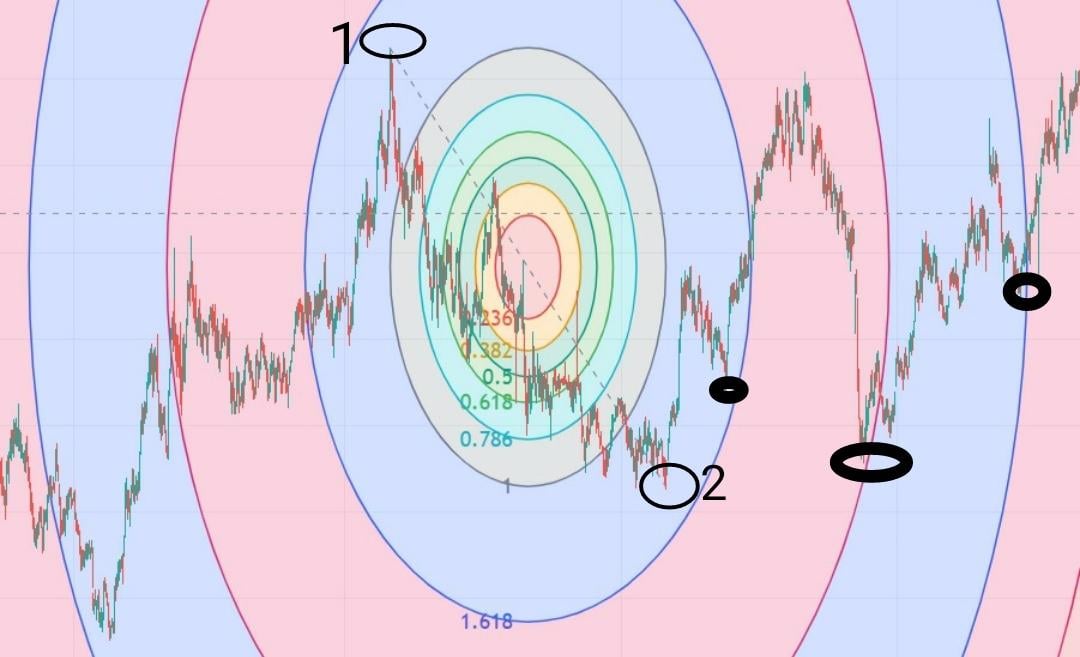
The image above connects a high and a low (represented by points 1 and 2). The tool draws circles that are separated from each other by a distance determined by the Fibonacci sequence.
The encircled points show the various points where the underlying takes to support or shows resistance when it touches or comes in contact with the Fibonacci circles.
Note
It's crucial to remember that none of those mentioned above Fibonacci-based trading methods can ensure success. Before making any trading choices, these tools should be utilized in conjunction with additional technical and fundamental variables.

Free Resources
To continue learning and advancing your career, check out these additional helpful WSO resources:


or Want to Sign up with your social account?