QUARTILE.EXC Function
An Excel Statistical Function that excludes the 0 and the 100th percentile from the result, i.e., the minimum and maximum values returning only the three quartile values.


What is the QUARTILE.EXC Function?
The QUARTILE.EXC function in Excel excludes the 0 and the 100th percentile from the result, i.e., the minimum and maximum values returning only the three quartile values.
Wait, what?
What do we mean by a quartile, though? Well, quartiles are the numerical values that group a range of values into three quartiles.
The concept of Quartile is often compared with the percentile, which divides a dataset into 100 equal parts. Percentile has no universal definition. However, it can be interpreted as the number below which the ‘x’ percentage of data falls.
The three different quartiles that the function returns are:
- 1st Quartile(Q1)—Q1 represents the 25th percentile, implying 25% of the values in the data fall within the numerical value returned.
- 2nd Quartile(Q2)— Q2 represents the 50th percentile or the median/middle value below which 50% of the values fall.
- 3rd Quartile(Q3)—Q3 represents the 75th percentile, implying that 75% of the data values fall within the numerical value returned.
Apart from these three values, there are also the maximum and the minimum values, which are the 100th percentile and 0th percentile values, respectively.
However, the function does not return those values and does not even consider them in evaluating those numbers in the dataset.
Perhaps we should see an example to understand how the function works. But first, let’s see the process and its syntax.
- The QUARTILE.EXC function is an Excel Statistical Function used to calculate the exclusive quartile of a dataset, which divides the data into four equal parts.
- Users provide two arguments to the QUARTILE.EXC function: the array of data points and the quartile number (1 to 4). It returns the value corresponding to the specified quartile.
- Potential errors that users might encounter when using the QUARTILE.EXC function, such as providing non-numeric values or referencing cells with incorrect data, and how to address them effectively.
- QUARTILE.EXC function finds applications in finance, economics, and other fields where analyzing data distributions and identifying percentile values are important decision-making, risk management, and forecasting.
QUARTILE.EXC function Formula
The QUARTILE.EXC function is categorized as a Statistical function that returns the three quartiles for a range of values.
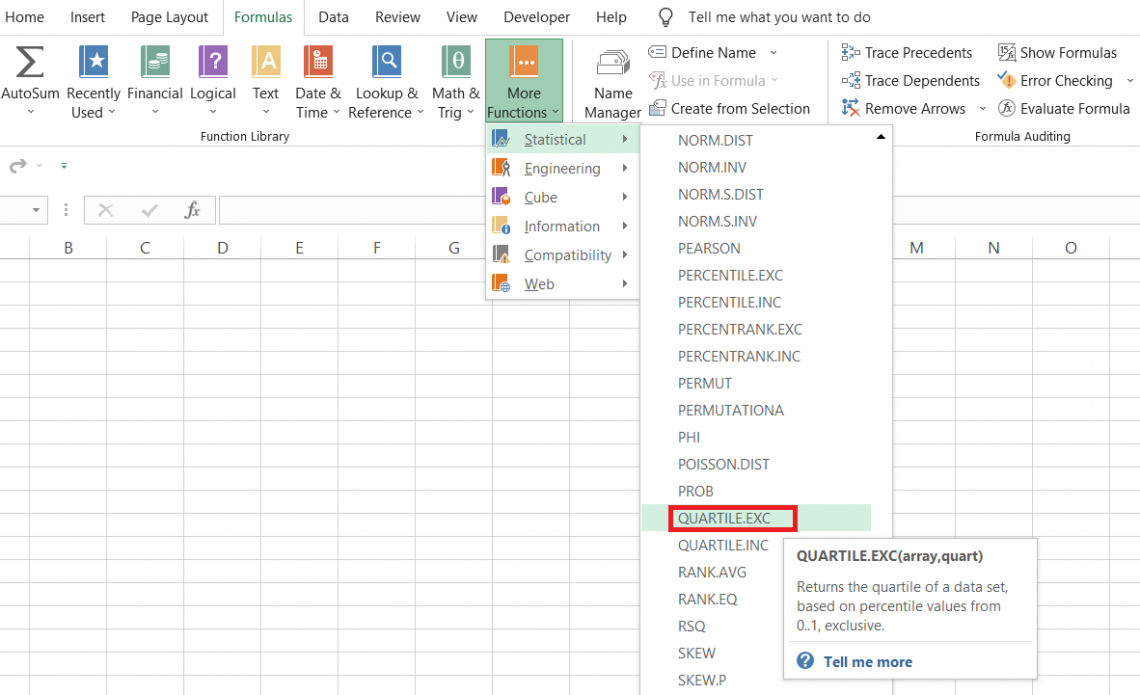
Previously, Excel offered only the QUARTILE function, but it was replaced by QUARTILE.EXC and QUARTILE.INC to provide more control to the users over what the function can do.
Both functions were introduced in the Excel 2010 version and have been present in all subsequent versions.
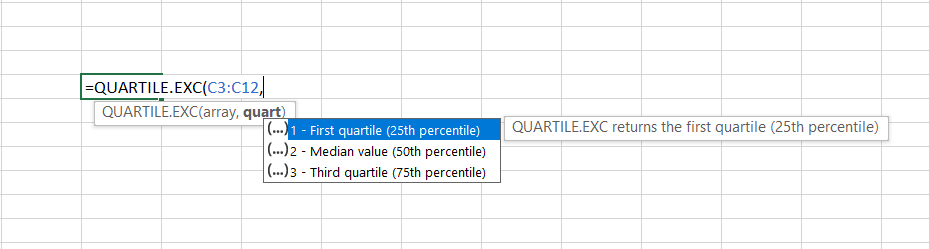
The syntax for the function is:
=QUARTILE.EXC(array,quart)
Where
- array - (required) reference to the range of value in the dataset.
- quart - (required) refers to the quartile value we intend to return.
The quart argument will only accept three values, as illustrated below:
| Value | Quart |
|---|---|
| 1 | Q1 - 25th percentile of values lie below this number |
| 2 | Q2 - 50th percentile of values lies below this number |
| 3 | Q3 - 75th percentile of values lies below this number |

How to interpret the Quartile value?
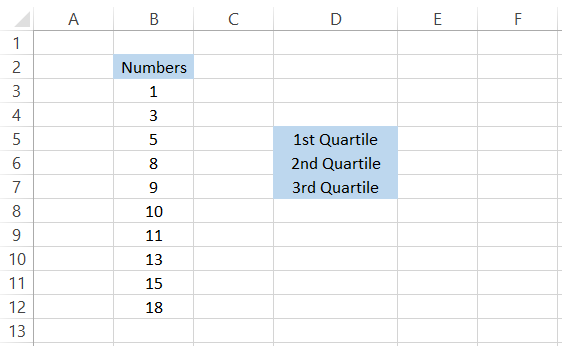
Suppose you have the range of values as 1, 3, 5, 8, 9, 10, 11, 13, 15, and 18. We will try to find all three quartile values using the function.
Since the numbers are already arranged in ascending order, we know the minimum and maximum values, also called the 0th and the 100th percentile values.
However, we do not have to be concerned about those since the function does not consider those two values in the data range to evaluate the three-quartile values.
The tricky part is the interpretation of the quartile values. We get the Q1 as 4.5, which means that 25% of the values are below this number. The Q2 is 9.5 while the Q3 is 13.5, representing 50% and 75% of values in the dataset below those numbers.
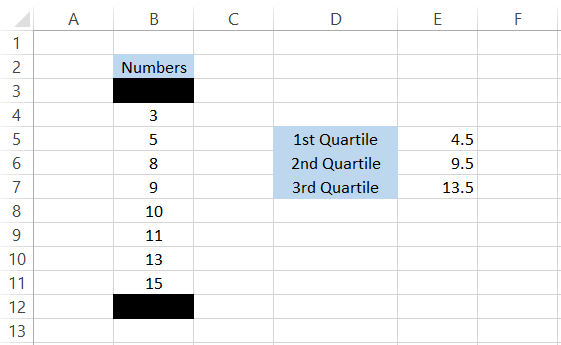
We have eight numbers in the dataset apart from minimum and maximum values, i.e., excluding those.
Q2 is the median value from the dataset. Since we do not have the odd number of observations in the dataset, the result gets interpolated between 9 and 10, which are the two middle values. Thus, the resultant quartile value is equal to 9.5.
Since we know that Percentiles and Quartiles are closely related, assume that the remaining range of values is a total percentage of 100.
As there are eight observations, we will divide 100 by 8, which gives us each number weightage as 12.5% in the given dataset.
Now, coming to the Q1, which is equal to 4.5, has only 3 as the number below. Since a single number constitutes 12.5%, if there were two numbers, the weightage would have been equal to 25%, which defies the quart logic of values below the 25th percentile.
The same reasoning applies for Q3 from the bottom, where just one value is above the 75th percentile, equal to 15, while the rest fall below the Q3 or the 75th percentile.
It is important to remember that the values eventually get interpolated if there are many observations after excluding the minimum and maximum values from the dataset.
How to use the QUARTILE.EXC Function in Excel?
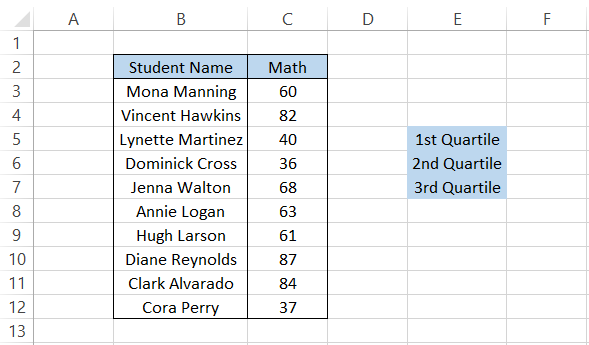
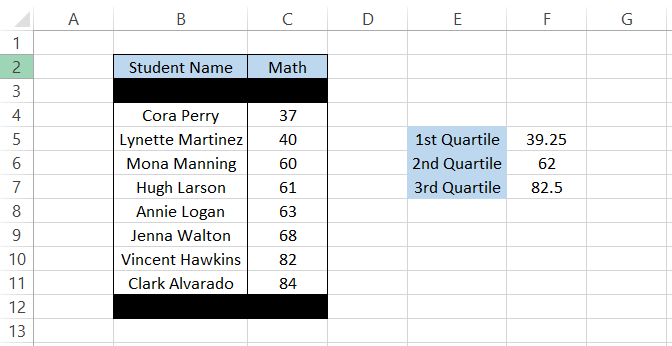
Suppose that you have the test scores for the students, as illustrated below:
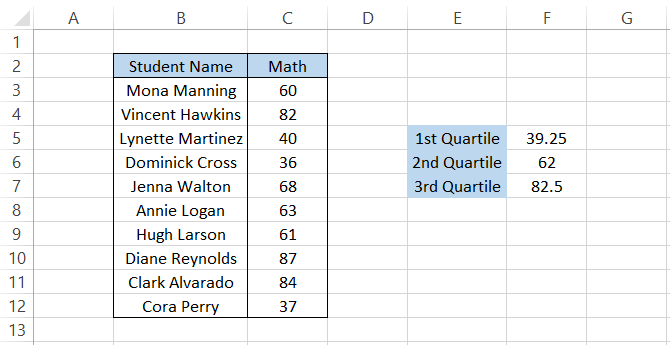
We will use the formula =QUARTILE to get the first quartile value. For example, EXC($C$3:$C$12,1) in cell F5 gives us the result of 39.25.
To get the other values, we will copy the formula and change the quart argument, which provides us with the result:
How do we interpret the result?
Firstly, we will reorder the test scores in ascending order. This step is unnecessary; however, it will help you understand whether or not the quartile values returned are correct.
Select the range C3:C12 and press the keyboard keys Alt + H + S + S, which will give you the dialog box, as illustrated below:
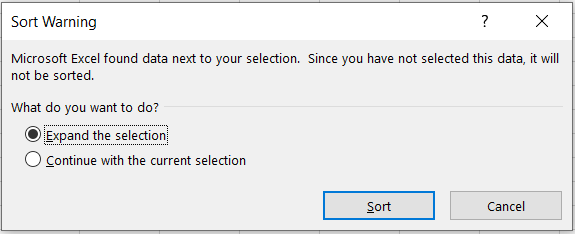
Select 'Expand the selection' and then click on 'Sort.' The test scores sorted in ascending order would look like this:
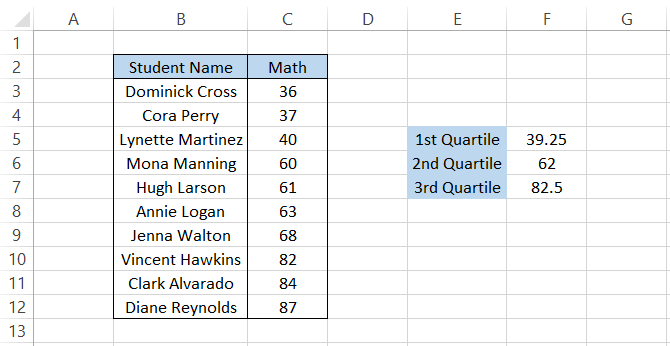
First, we will cancel out the dataset's maximum and minimum values since the function does not include them in the quartiles' calculation.
Thus, we have eight values in the dataset, which means the quartile values would ultimately be interpolated since we have an even number of observations in the dataset.
The Q1, i.e., 39.25, represents the values below the 25th percentile. Dividing the observations by 100, we find that each number contributes 12.5% to the total. Thus, the test score of 37, forming 12.5%, is the only value under Q1.
Q2 is 62 while Q3 is 82.5, meaning that the 50th and 75th percentile values fall below that number(not even equal to that number).
Let's see another example where we might end up with an odd number of observations after the minimum and maximum values cancel out. Suppose you remove the dataset's test scores for 'Jenna Walton.'
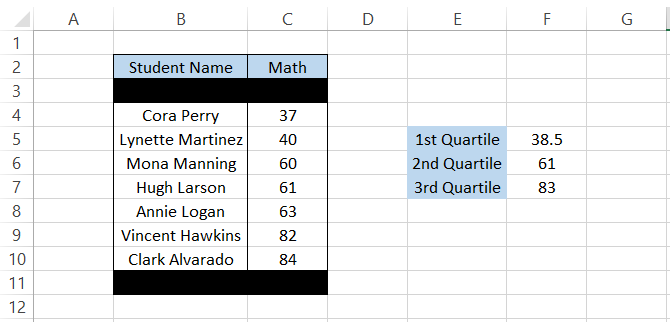
The quartile values immediately change to different values. Here, we find that Q2 does not interpolate but is the median value, which is equal to 61 scored by High Larson.
However, Q1 and Q3 have values that result from interpolation between the two numbers. For example, Q1 is equal to 38.5 while Q3 is equal to 83.
Note
Using the function, you don't need to sort the data in ascending order. However, in our example, the data is arranged in ascending order to better understand what happens behind the scene when you use the formula in Excel.

QUARTILE.INC vs. QUARTILE.EXC Function
The QUARTILE.INC was another function that Microsoft added as a newer version of Quartile in Excel 2010.
If the QUARTILE.EXC function excludes the minimum and maximum values from the dataset. Then, you can already imagine the QUARTILE.INC can do that.
Yes, you are right. It will 'include' the minimum and maximum values in our dataset and find the quartile values based on the entire range referenced in the formula.
The syntax for the function is
=QUARTILE.INC(array, quart)
where
- array - (required) reference to the range of values in the dataset.
- quart - (required) refers to the quartile value we intend to return.
Here, the quart argument can accept five different values, as illustrated below:
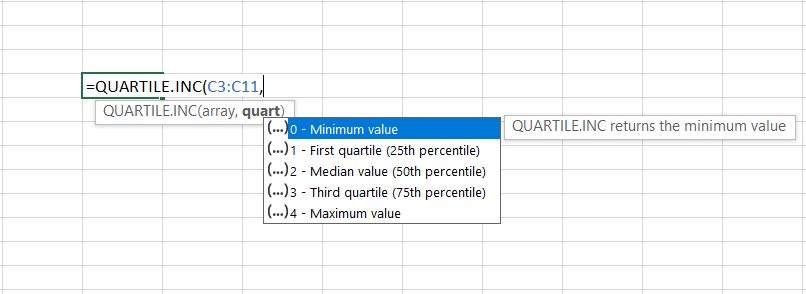
| Value | Quart |
|---|---|
| 0 | Minimum Value |
| 1 | Q1 - 25th percentile of values lie below this number |
| 2 | Q2 - 50th percentile of values lies below this number |
| 3 | Q3 - 75th percentile of values lies below this number |
| 4 | Maximum Value |
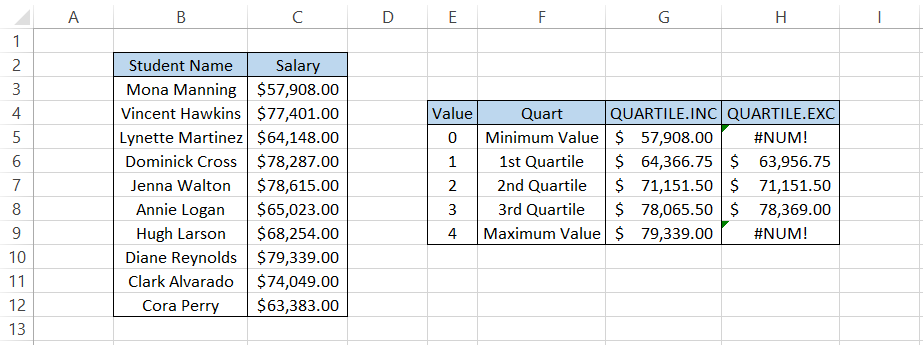
Let's see an example to see whether both functions return the same results. Suppose you have the data as illustrated below:

We will use the formula =QUARTILE.INC($C$3:$C$12, E5) in cell G5 and drag it down to cell G9. Similarly, we will use the formula =QUARTILE.EXC($C$3:$C$12, E5) in cell H5 and drag it to the H9 cell to give the result:
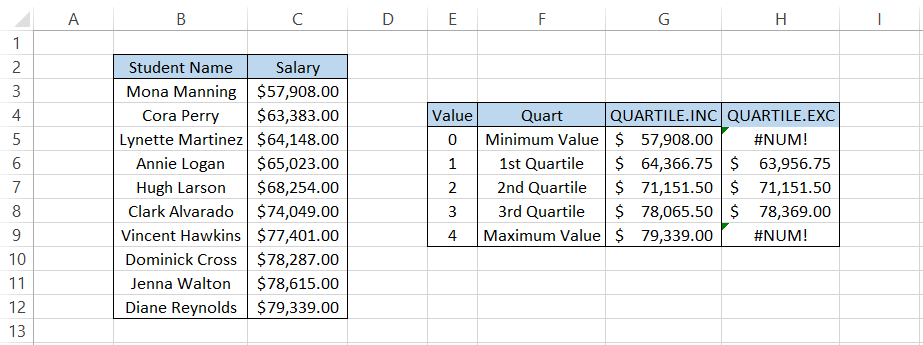
Firstly, we get the NUM! Error for QUARTILE.EXC since it does not return the minimum and maximum value or identify the quart arguments zero and four.
Suppose we arrange the salaries in ascending order. In that case, we get:
We see that Q2 equals $71,151.50 in both cases, implying 50 percent of the data falls below that number, which is fitting, as shown below:
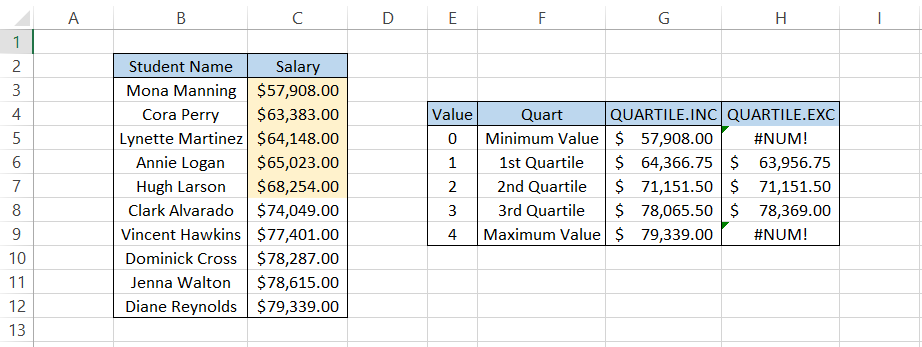
The Q1 equals $64,366.75, where roughly 25 percent of the values from the dataset fall under that number.
The Q3 value says that 75 percent of the values from the dataset fall under this number, equal to $78,065.50.
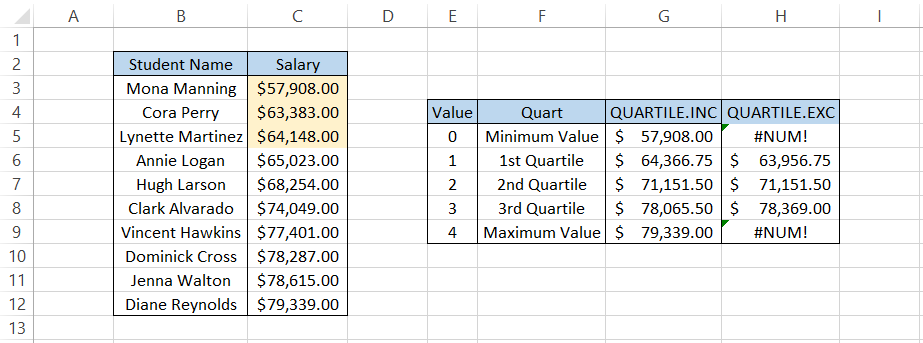
The above interpretation is valid only for the QUARTILE.INC function and would change for its counterpart.
QUARTILE vs. QUARTILE.INC Function
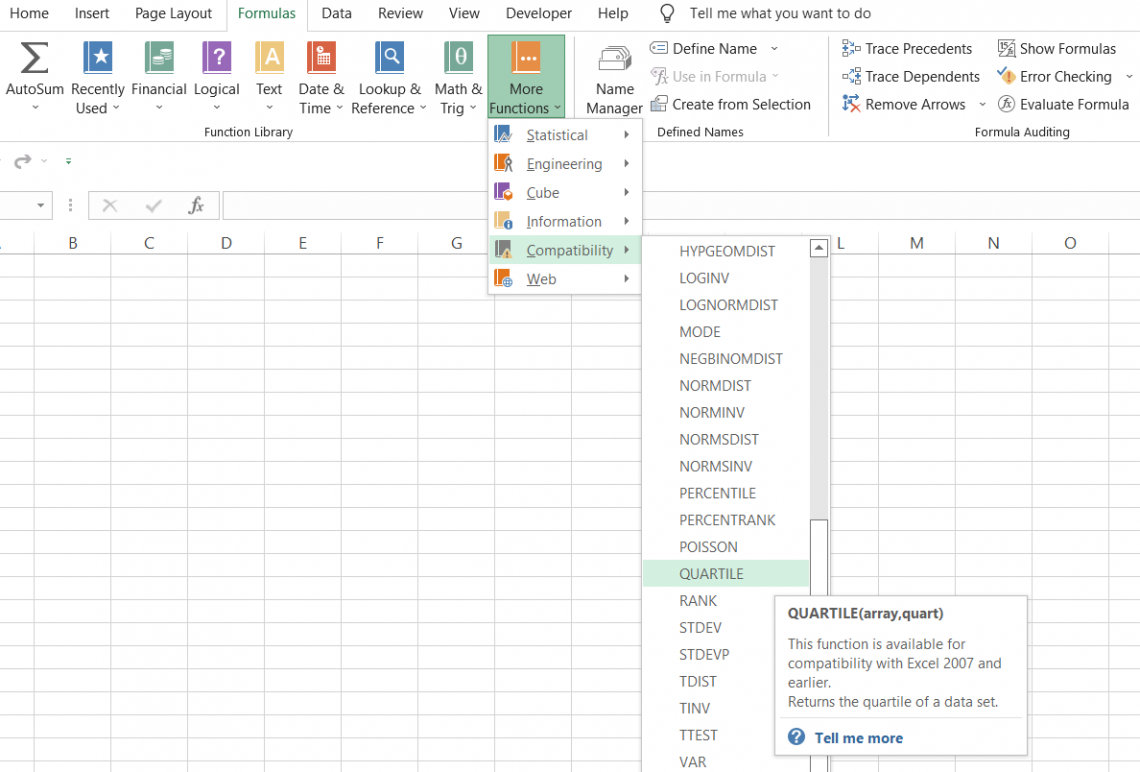
The QUARTILE was the first native function used to calculate the quartile values in Excel. However, later on, in Excel 2010, it was replaced by two of its successors, i.e., QUARTILE.EXC and QUARTILE.INC
The function works similarly to QUARTILE.INC by returning the three quartiles and the minimum and maximum values.
Even though the function is replaced by its two successors, you can still find it under the compatibility section for backward compatibility.
The syntax for the function is
=QUARTILE(array, quart)
Where
- array - (required) reference to the range of values in a dataset.
- quart - (required) refers to the quartile value we intend to return.
Again, the quart accepts only five different values, as illustrated below:
| Value | Quart |
|---|---|
| 0 | Minimum Value |
| 1 | Q1 - 25th percentile of values lie below this number |
| 2 | Q2 - 50th percentile of values lies below this number |
| 3 | Q3 - 75th percentile of values lies below this number |
| 4 | Maximum Value |
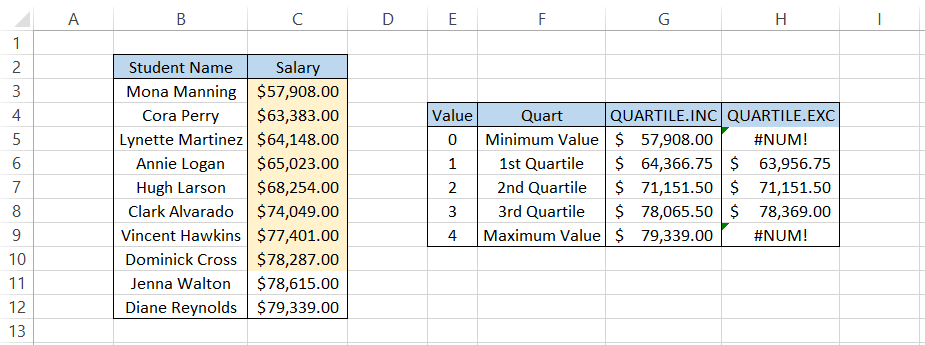
Suppose you have the test scores for students, as shown below:

Here, we will use the formula =QUARTILE($C$3:$C$12, E5) in cell G5 and drag it down to cell G9. Similarly, we will use the formula =QUARTILE.INC($C$3:$C$12, E5) in cell H5 to H9, which not surprisingly gives similar results as:
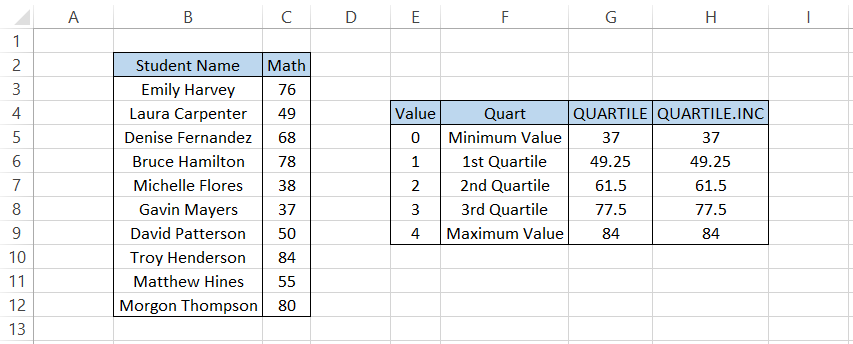
Since the QUARTILE function is the shadow of the newer version, both parts yield identical results.
However, it is still advisable to use the newer versions of the function as we might never know when Excel will discontinue the usage of the compatibility version.
Free Resources
To continue learning and advancing your career, check out these additional helpful WSO resources:


or Want to Sign up with your social account?