VARA Function
An Excel Statistical Function that returns variance for a sample of data.

What is the VARA Function?
The VARA function is an Excel Statistical Function that returns variance for a sample of data. Variance is a distribution parameter that measures how far a set of values is spread from their average value (the mean).
Excel offers six variance functions:
- VAR: calculates sample variance while ignoring the text and logical values (TRUE or FALSE).
- VARP: calculates population variance while ignoring the text and logical values.
- VAR.S: calculates sample variance while ignoring the text and logical values.
- VAR.P: calculates population variance while ignoring the text and logical values.
- VARA: calculates sample variance while considering text and logical values.
- VARPA: calculates population variance while considering text and logical values.
Starting with Excel 2010, VAR and VARP were replaced by VAR.S and VAR.P, respectively.
VAR and VARP are available only for backward compatibility with Excel 2007 and earlier.
In finance, the VARA function can be useful in measuring variance in revenues/expenses and portfolio risk level.
The VARA function is a built-in Excel function, which you can locate on the Formulas tab. Alternatively, you can use it as a worksheet function by selecting any cell and typing in the function syntax.
- The VARA function is an Excel Statistical Function is used to calculate the variance of a sample of data.
- The VARA function calculates the variance of a sample of data points. Variance measures how much the values in a dataset vary from the mean. It is a measure of dispersion or spread.
- The VARA function first calculates the mean (average) of the dataset, then calculates the squared deviation of each data point from the mean, and finally computes the average of these squared deviations to obtain the variance.
- The VARA function may return an error if the dataset contains no numerical values or if all values in the dataset are non-numeric. In such cases, it may return a #VALUE! error indicating that the calculation cannot be performed.
Variance Explained
In 1918, Ronald Fisher introduced the concept of variance, the measure of variation. Variance measures the amount of variation or dispersion of a set of values. It can be calculated for the entire population or a sample of data.
Population variance can be calculated using the following formula:

where:
- xi - each value from a population
- µ - is a population mean
- N - is the size of a population
And the following formula is used to calculate the sample variance:

where:
- xi - each value from a sample
- x̅ - is a sample mean
- n - is the size of a sample
Let’s consider a sample variance calculation example. Over the past five years, the fund produced various returns to its investors, ranging from positive 3,8 percent to negative 13,0 percent:
| Year | Fund's Returns |
|---|---|
| 2018 | 9,2 |
| 2019 | 3,8 |
| 2020 | 13,1 |
| 2021 | 1,6 |
| 2022 | -13,0 |
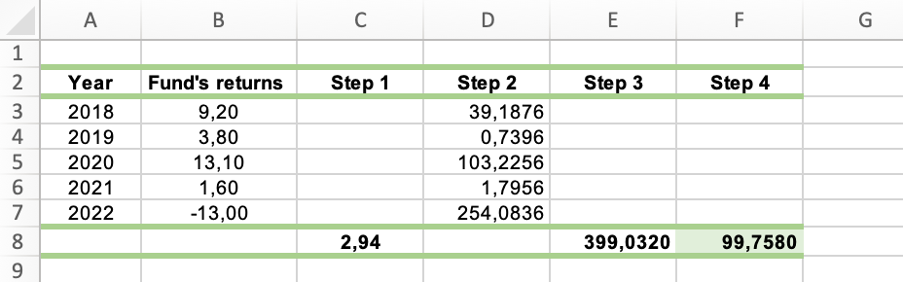
To calculate the sample variance, the following steps have to be followed:
1. Calculate the sample’s mean:
(9,2 + 3,8 + 13,1 + 1,6 - 13,0) / 5 = 2,94
2. Calculate the squared deviations of each of the returns from the mean:
(9,2 - 2,94)2 = 39,1876
(3,8 - 2,94)2 = 0,7396
(13,1 - 2,94)2 = 103,2256
(1,6 - 2,94)2 = 1,7956
(-13,0 - 2,94)2 = 254,0836
3. Sum the values of calculated squared deviations:
39,1876 + 0,7396 + 103,2256 + 1,7956 + 254,0836 = 399,0320
4. Divide the sum of the squared deviations from the mean by n-1, where n is the number of years:
399,0320 / (5 – 1) = 99,7580
One problem with the variance is that it does not have the same measurement unit as the original data (the original containing data measured in feet will have a variance measured in square feet, etc.).
Standard deviation is more useful in this respect as it removes the units from the analysis and allows direct comparison between things that may have different measurement units.
Note
When the values tend to be close to the mean of the set, and to each other, the variance is low. Contrarily, the variance is high when the values spread over a wider range.
How to Use the VARA Function?
There are three ways to access the VARA function in Excel:
1. Formulas tab
First, you can utilize the Formulas tab and find the function under the Statistical category.
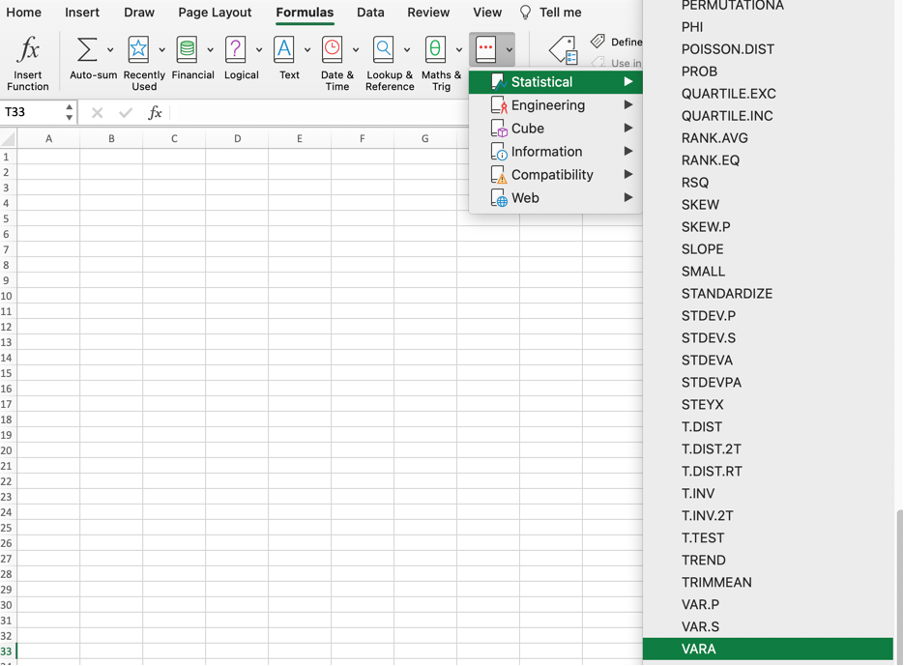
Once you locate the function, select it, and start typing in the arguments it prescribes. The arguments will be further covered below.
2. Entering Formula into the Worksheet
Another way of accessing the function is the manual input of the function in a selected cell on a worksheet.
This approach entails selecting the cell and typing in the function that follows:

where:
value1; [value2]; … – values 1 to 255 corresponding to a sample of a population.
Values can be numbers, names, arrays, or reference values.
Note
While value1 is required, subsequent values are optional when using the formula.
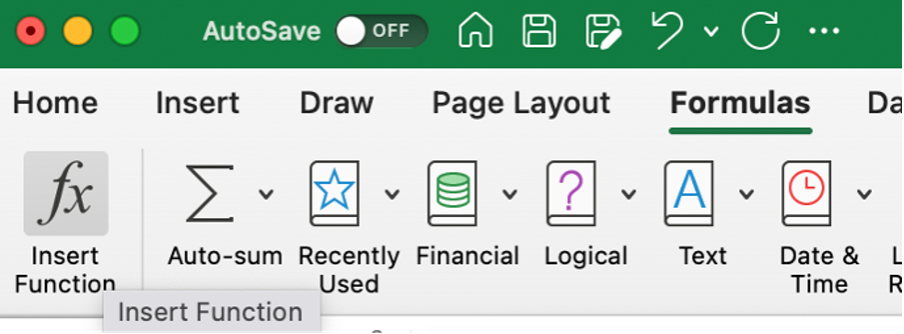
3. Utilizing the Formulas Tab with Manual Input
Finally, there is an option to access the function through the Formulas tab while utilizing the manual input simultaneously.
Select the Formulas tab, click the Insert Function, and start typing the VARA function’s syntax.
Example: Consider the fund’s returns from the previous example. We will only use the VARA function to calculate the sample variance this time.
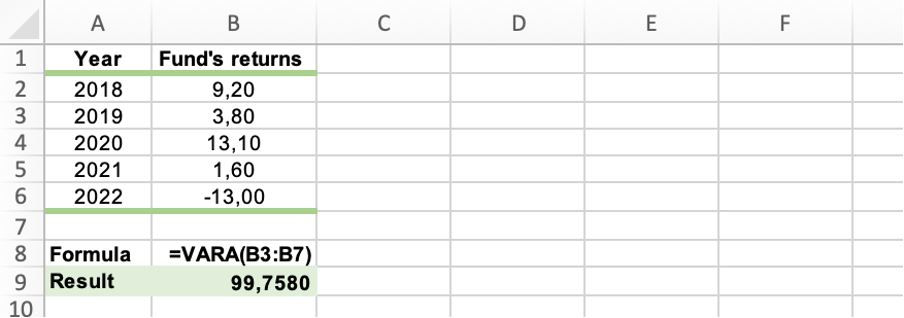
The result corresponds to the one obtained using the manual calculation method.
Things to Remember About the VARA Function
Excel is a great tool that allows you to utilize your time more efficiently when it comes to the performance of calculations and data analysis. However, some things need to be considered when using the functions, and the VARA function is no exception.
It is important to remember this because failure to do so may lead to an incorrect interpretation of the results.
The things to remember are
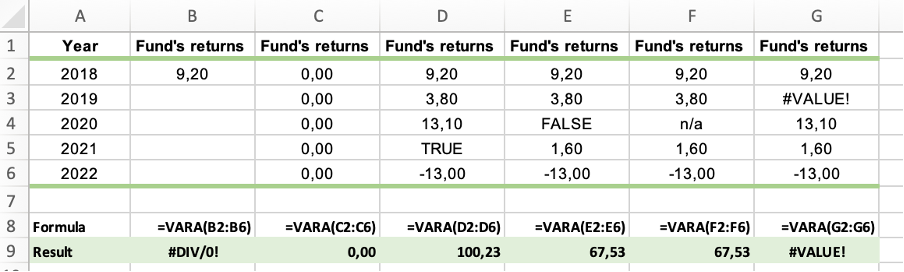
- The #DIV/0! Error occurs whenever less than two values are inputted into the function.
- The #VALUE! Error occurs in one of two cases – first, when the inputted values are error, and second when the inputted values cannot be interpreted as numeric values.
- The VARA function considers text and logical values directly typed into the list of arguments in a calculation. Therefore, you should use it when evaluating text and logical values in a calculation.
- The function assigns a value of 0 to any text, a FALSE logical value, and a value of 1 to a TRUE logical value.
- The function calculates the sample variation (using the "n-1" method). Different functions (for example, VARPA) should be used if your data represents the entire population.
- The VARA function ignores the empty cells.
- Only values in the selected array or reference are used in the function’s argument.
- When working with a data set containing zero values, the function will return a variance of 0.

Free Resources
To continue learning and advancing your career, check out these additional helpful WSO resources:


or Want to Sign up with your social account?