VAR.S Function
An Excel Statistical Function used to assess the variance from the sample data.


What is the VAR.S Function?
The VAR.S Function is an Excel Statistical Function used to assess the variance from the sample data. The function gauges how much the sample data varies from the mean.
The VAR.S function is a computational function used in Microsoft Excel to calculate the variance of a given model.
Estimating a model's variance involves assessing the spread of data points around the mean. Mathematically, variance measures the average squared deviation of each data point from the mean of the dataset.
Similarly, the Excel function VAR.P also calculates the variance of a given model. The major difference between the two functions is the sample size being studied. The VAR.P function in Excel calculates the variance of a population, considering all data points, rather than just a sample.
The VAR.S function in Excel calculates the variance of a sample, representing a subset of the entire population. This may yield a different result compared to calculating the variance for the entire population
-
The VAR.S function is an Excel Statistical Function that is used to calculate the sample variance of a dataset, representing the dispersion or spread of data points around the mean.
-
Users provide an array of data points as the argument to the VAR.S function. It returns the sample variance of the dataset, representing the average squared deviation from the mean.
-
Potential errors that users might encounter when using the VAR.S function, such as providing non-numeric values or referencing cells with incorrect data, and how to address them effectively.
-
VAR.S function aids in statistical analysis by quantifying the variability or dispersion of data points within a dataset, providing insights into the distribution and characteristics of the data.
Formula Of VAR.S Function
To calculate the variance of a model, you will need the following formula:
VAR(number1, [number2],..)
Where
- Number1 (required argument): Represents the initial argument about a sample of a population
- Number 2,… (optional argument): These additional arguments can include up to 254 values or arrays of values, ensuring a minimum of two values for the function
All inputs for the VAR.S function must be numerical values. Text representations, such as “one” or “two,” are not accepted in the VAR.S calculation in Excel.
How to use The VAR.S Function in Excel?
The VAR.S function can be navigated within the Excel sheet in the following steps:
- Formula tab
- More Functions
- Statistical
- VAR.S
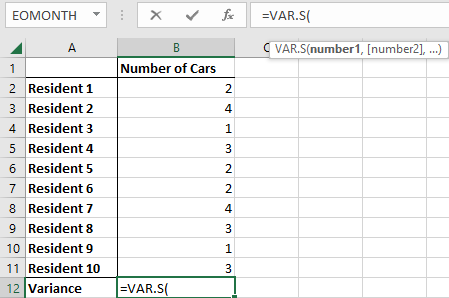
For a quicker search, simply type in “=VAR.S” in the desired cell or table and continue utilizing the sample set to reach your calculations of the given dataset.
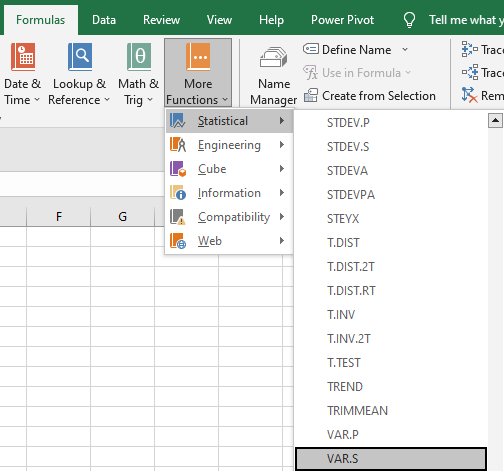
Another way to locate the VAR.S function is to follow the steps as directed in the instructions:
- In the Excel sheet, locate the Formulas tab at the top bar
- Click on More Functions
- In the dropdown bar, you will see six additional categories. Click on Statistics
- Another drop-down bar will appear with functions in alphabetical order. Simply scroll down and locate “VAR.S.”
Remember that VAR.S calculates the variance of a sample dataset, while the VAR.P function calculates the variance of an entire population.
Note
The VAR function in Excel will return the same answer as the VAR.S function because both functions take the data from a given sample set to calculate its variance.

VAR.S Function Example
For example, let's find the number of cars owned by ten residents living in an apartment complex to calculate the variance of the residents who own cars.
As shown above, we took a portion or a small sample of an entire apartment complex to calculate the variance. In doing so, the VAR.S function is most suitable for this specific dataset of residents who own cars.
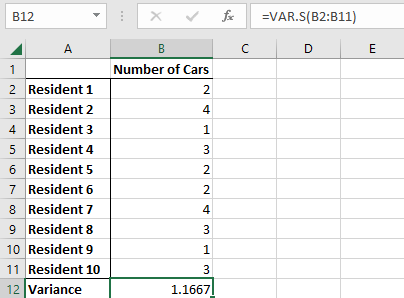
Once we input the necessary data, you may notice that the variance is calculated at the bottom. The component “number1” category is labeled as the number of residents studied in the sample and the number of cars.
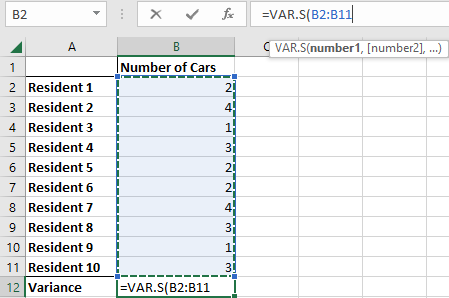
In the highlighted cell, B12, the calculated variance for the number of cars residents own is 1.1667. The formula bar also represents this calculation as “=VAR.S(B2:B11)”.
If you have a second sample set, highlight the first sample set for “number1” followed by a comma, then highlight the second for the optional formula component “number2.”
Double-check for errors in calculations to ensure accurate data input. Errors such as #DIV/0! or #VALUE! may arise due to:
- Inputting only one numerical value
- Inputting non-numerical values

Free Resources
To continue learning and advancing your career, check out these additional helpful WSO resources:


or Want to Sign up with your social account?