STDEV.P Function
The STDEV.P function in Excel calculates a population's standard deviation providing insights into data variability.


What is the STDEV.P function?
The STDEV.P function, also known as STDEVP, belongs to the Excel Statistical functions category. It offers a reliable method to calculate the standard deviation for a complete population, disregarding logical values and text.

This function is particularly valuable for financial analysts, as it aids in evaluating deviations in revenue and helps portfolio managers assess the risk associated with their portfolios.
In statistical analysis, the standard deviation is a crucial measure that helps us understand the spread or variability of data within a population. Excel provides the STDEV.P function, which calculates the standard deviation based on the entire population given as arguments.
The STDEV.P function was introduced in Microsoft Excel 2010, making it unavailable in earlier versions. However, it essentially serves as an updated version of the older STDEVP function, offering improved accuracy and reliability in standard deviation calculations.
The Standard Deviation of a Population function in financial analysis proves invaluable when measuring and monitoring revenue deviations.

By calculating the standard deviation of revenue data, analysts gain insights into the level of fluctuation and potential risks associated with revenue streams.
Portfolio managers also rely on standard deviation as a crucial metric for evaluating the risk and volatility of investment portfolios. Using the Standard Deviation of a Population function enables you to perform accurate standard deviation calculations quickly and efficiently.
You can make informed decisions, find out outliers, and learn more about the underlying trends and patterns if you understand how many data points are present in a population.
This comprehensive article will explore the STDEV.P formula in-depth, providing clear explanations, practical examples, and step-by-step instructions.
We will also discuss essential points to keep in mind to optimize your usage of the STDEV.P function, discuss common mistakes to avoid, troubleshoot issues you may encounter, and explore related formulae that complement the standard deviation analysis.
- The STDEV.P function calculates the standard deviation for a population dataset. The STDEV.P function in Excel calculates a population's standard deviation providing insights into data variability.
- Users provide the dataset as arguments to the STDEV.P function. It returns the standard deviation, which measures the dispersion or variability of values within the dataset.
- The STDEV.P function is commonly used in statistical analysis to quantify the spread of data points around the mean, providing insights into a dataset's consistency or variability.
- Potential errors that users might encounter when using the STDEV.P function, such as providing non-numeric values or referencing cells with incorrect data, and how to address them effectively.
Syntax of STDEV.P Function
To use the Standard Deviation of a Population function, you need to understand its syntax and parameters.
The syntax of the STDEV.P function is as follows:
=STDEV.P(number1, [number2], ...)
The syntax of this Function in Excel has the following arguments,
- Number 1 (required argument) refers to the first number argument in the data set corresponding to a population.
- Number 2 (optional argument) refers to the second argument in the data set corresponding to a population.
- A single array or a reference to an array may be used instead of arguments broken down by commas.
Note
While using the STDEV.P formula, up to 254 arguments can be included.
The Excel versions earlier than the 2010 versions had the STDEVP Function; however, since the 2010 version, the STDEVP Function has been replaced by STDEV.P; now, the new version, like the earlier versions, performs the same function as its predecessor.
The return value of the Syntax of this statistical function is the estimated standard deviation.
In interpreting a standard deviation, an account should be taken of the fact that there is more variability or dispersion in the population with higher standard deviations. By contrast, the lower standard deviation indicates less variability at data points closer to the mean.

This function can be applied to several areas, such as financial services, economics, quality control, research, and others, where the identification of variations in population is important for analysis and decision-making.
This information holds significant value when it comes to making a well-informed choice, recognizing patterns or trends, and evaluating the degree of risks and uncertainties associated with a particular population.
Using Excel's Standard Deviation of a Population function will provide valuable insight into data variability.

Examples of STDEV.P Function
We just discussed the syntax and components of the Standard Deviation of a Population Function in Excel; now, let's look at some examples to understand how the function works in Excel.

Let us take a look at Example 1:
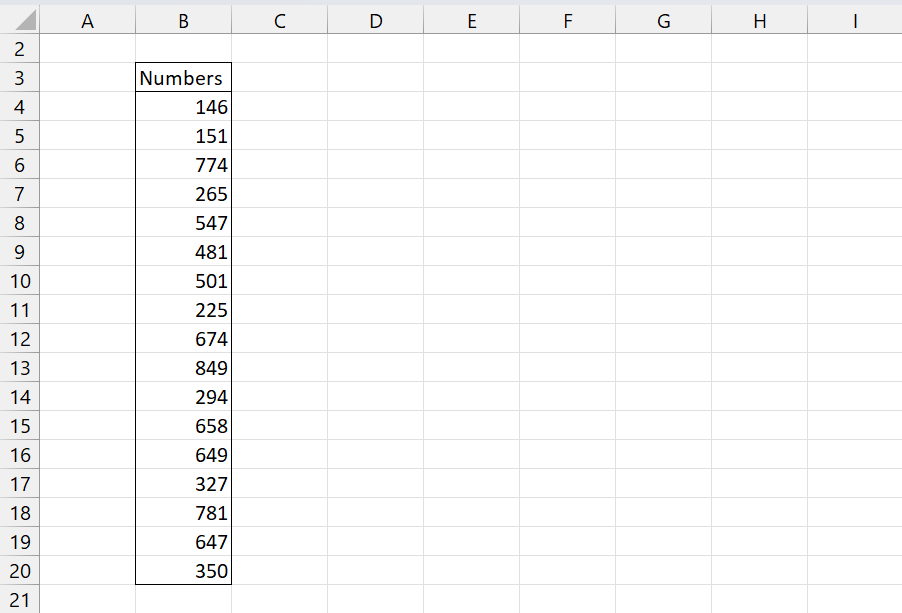
Let's have a look at the data provided in the picture above. Here the Numbers between 100 and 1000 are given from Cell B4 to B20 (B4:B20).
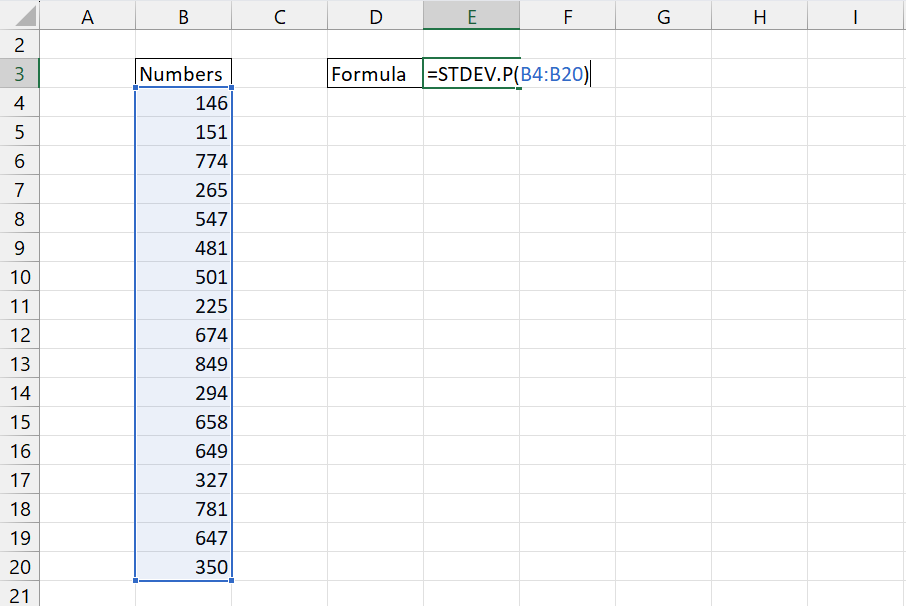
In this picture, it can be seen that the data in the number column is used as the number1 argument in the syntax of STDEV.P. We use the following formula in Cell E3 to arrive at the result,
=STDEV.P(B4:B20)
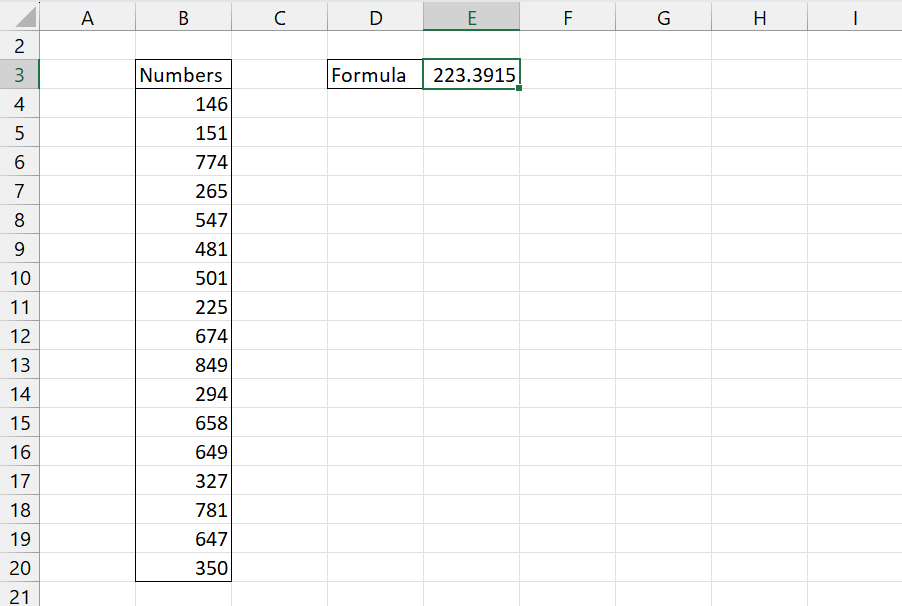
Now, in this last picture, it can be seen that after applying the STDEV.P Function in cell E3 we arrive at the Standard Deviation of the Population, which is 223.3915.
For Example 2:
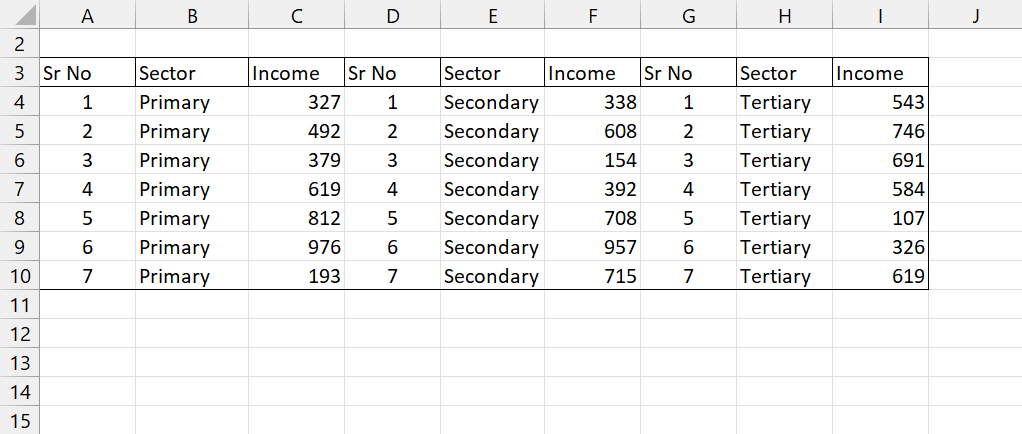
In the second example above, the data shows the income of 21 employees, 7 each working in primary (C4:C10), secondary (F4:F10), and tertiary sectors (I4:I10). The data given in the “Income” column will be subject to our Standard Deviation calculation.
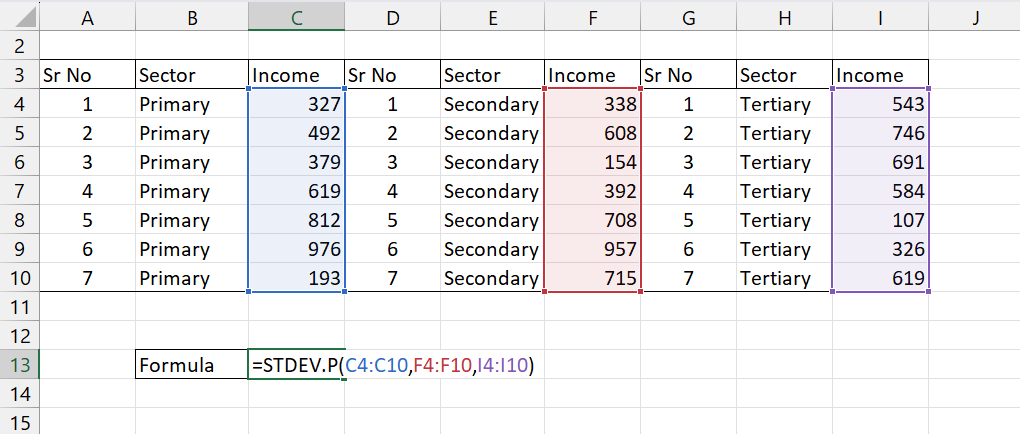
Here, we apply the STDEV.P Formula in cell C13 like the picture above, to get the desired result for the standard deviation of a population.
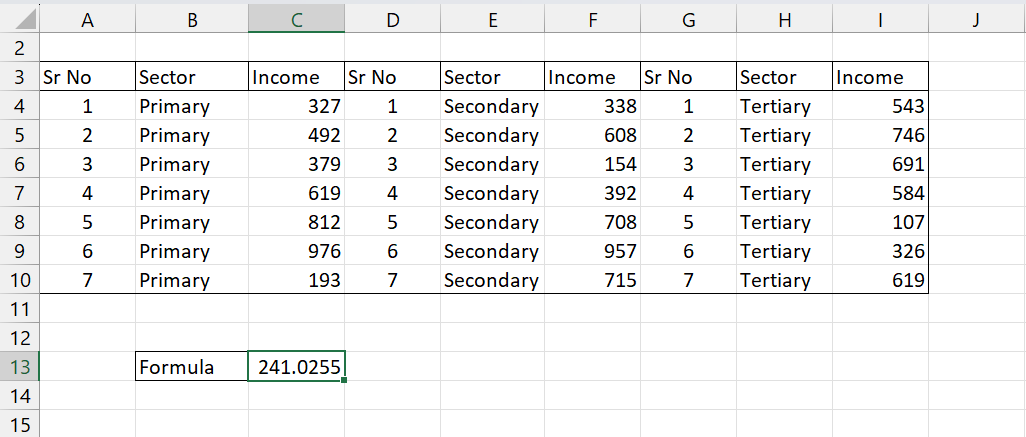
In the above picture, it can be seen that after applying the standard deviation of a population formula, we arrive at the result for the standard deviation of employees across the primary, secondary, and tertiary sectors, which is 241.0255.
The standard deviation of 241.0255 is quite large relative to the range of the data (822 units), suggesting that the data points are spread out widely from the mean. This implies that the values within the dataset deviate significantly from the average value.
Considering the context, a high standard deviation of 241.0255 indicates that the data points are widely scattered and do not cluster tightly around the mean. This variability suggests a higher level of uncertainty or diversity within the dataset.
Now, for example 3:
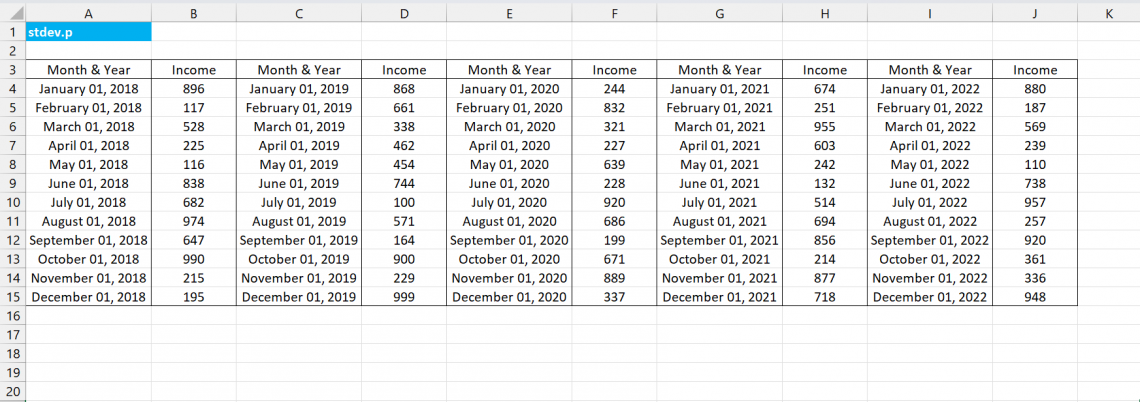
In the third example above, the data shows a person's income from passive investments across 5 years from 2018 to 2022. The data in the Income column in each of the 5 years is out data, which is subject to Standard Deviation calculation.
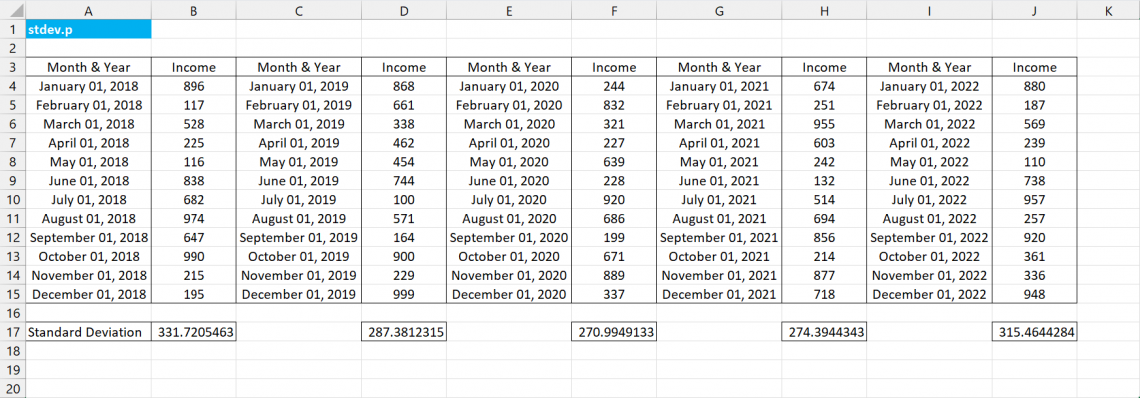
Here, after applying the STDEV.P Formula in Cells B17, D17, F17, H17, and J17 for their respective Income column, and getting the standard deviation for a particular year as shown in the cells above.
Here, the standard deviation across the years is smaller, suggesting a lower variability among incomes over the years.
When comparing multiple datasets, a smaller standard deviation implies that the data points are closer to the mean and have less variability, while a larger standard deviation suggests greater variability and wider spread.
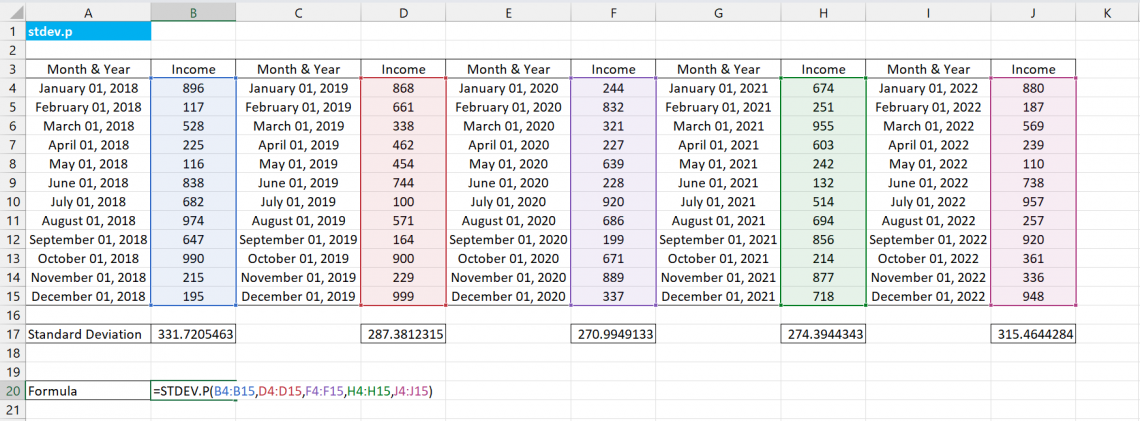
In this step, like the preceding examples, we use the Standard Deviation of a Population formula as shown in Cell B20 above to achieve the Standard Deviation of his income across the 5 years.
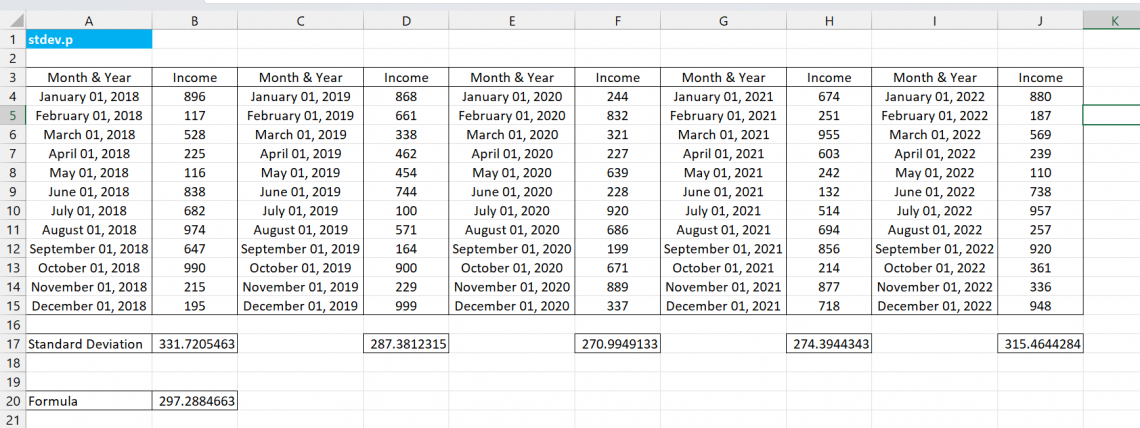
This step shows the result after applying the Standard Deviation Formula; the result is 297.2884663.
By observing and understanding the 3 examples above, one can easily understand how the STDEV.P Function works in Microsoft Excel.
STDEV.P Function: Points to Remember
While using the Standard Deviation of a Population function, it's essential to keep in mind a few points that can help you utilize the function more effectively and avoid potential issues:

- STDEV.P helps calculate the standard deviation for the population. If one needs to find the standard deviation for different data, one can use the STDEV or STDEV.S function accordingly.
- The arguments can be made either by hard coding data or by using cells referencing individual cells and a range of cells.
- Always recheck all the arguments in the syntax, especially while using this function in conjunction with other functions.
- If the function isn't working properly, you must check that you are using the latest version of the Standard Deviation of population formula, STDEV.P, and not STDEVP, which is an older function.
- The STDEV.P, as well as STDEV.S, will return similar values for larger sizes.
- The arguments in the syntax can be numbers, names, arrays, or cell references.
- This function uses the following formula,
√Σ (x – μ)2 / N
Where,
- Σ refers to the Sum
- x refers to the Value of the data
- μ refers to the Mean of the Population
- N refers to the number of observation
- The return value will be #DIV/0! when none of the matters supplied to the function are numeric, if the input contains text representations of numbers within an array, those values are not recognized as numeric.
- The return value will be #VALUE! if any of the values provided directly to the function are text values that cannot be interpreted as numeric values since the function accepts numerical input.
- If the argument is an array or a reference, only the numbers in it are counted. Empty cells, logical values, texts, and errors in an array or reference are not considered.
Mastering the STDEV.P function in Excel can enhance your data analysis capabilities, make more accurate assessments, and drive informed decision-making processes.
STDEV.P Function FAQs

The population standard deviation is consistently smaller than the sample standard deviation because the population standard deviation is calculated using the total population, where the values are known precisely.
In contrast, the sample standard deviation is based on a smaller population subset, introducing more uncertainty and requiring a larger estimate for the standard deviation.
Technically, you can still use the older version of the Standard Deviation of a Population Function since, despite the existence of the STDEVP function for backward compatibility reasons, Microsoft advises using the newer STDEV.P function instead.
The STDEV.P isn't the only Function in Microsoft Excel to calculate Standard Deviation. There are 3 functions in Excel to perform this calculation, and they are:
A. STDEV.P
The function helps to find the Standard Deviation of a Population. This formula will be used when the given data represents the whole population rather than a sample. It is represented by the formula,
= √Σ (xi – μ)2 / N
Where,
- Σ refers to A Greek symbol meaning “sum”
- xi refers to the ith value in the dataset
- μ refers to the population mean
- N refers to the total number of observations
B. STDEV.S
It is the function that helps calculate a Sample's Standard Deviation. This formula is to be used when the given data represents a sample rather than the whole population. It is represented by the formula,
= √Σ (xi – x)2 / (n-1)
Where:
- Σ refers to a Greek symbol that means “sum”
- xi refers to the ith value in the dataset
- x refers to the sample mean
- N refers to the total number of observations
C. STDEV
It is the function that also helps to calculate the Sample Standard deviation, i.e., the same as the STDEV.S Function in Microsoft Excel. The return value of both the STDEV.S and the STDEV Function in Microsoft Excel is the same.

Free Resources
To continue learning and advancing your career, check out these additional helpful WSO resources:


or Want to Sign up with your social account?