STDEVA Function
Statistical function in Excel used to calculate the standard deviation of a sample dataset.


What is the STDEVA Function?
The STDEVA excel function is a statistical function that returns the standard deviation for a sample of data. Standard deviation is a parameter of a distribution that measures the amount of variation of a set of values from the average value (the mean).
Overall, Excel offers six standard deviation functions:
- STDEV: calculates sample standard deviation while ignoring the text and logical values (TRUE or FALSE)
- STDEVP: calculates population standard deviation while ignoring the text and logical values
- STDEV.S: calculates sample standard deviation while ignoring the text and logical values
- STDEV.P: calculates population standard deviation while ignoring the text and logical values
- STDEVA: calculates sample standard deviation while considering text and logical values
- STDEVPA: calculates population standard deviation while considering text and logical values
Starting with Excel 2010, STDEV was replaced by STDEV.S while STDEVP was replaced by STDEV.P.
Currently, STDEV and STDEVP are available only for compatibility with Excel 2007 and earlier.
In finance, STDEVA can be useful when measuring the volatility of an investment. The greater the standard deviation of an investment, the greater the variance between the price and the mean, and the greater the volatility, and vice versa.
The STDEVA function can be found under the Statistical formulas category on the Formulas tab. It can also be used as a worksheet function, which can be entered as part of a formula in a worksheet cell.
-
The STDEVA function in Excel calculates the standard deviation for a sample of data, including text and logical values.
-
Excel offers various standard deviation functions, including STDEVA, STDEV, STDEVP, STDEV.S, STDEV.P, and STDEVPA, each with specific features.
-
In finance, the STDEVA function is useful for measuring investment volatility, with greater standard deviation indicating higher price variance from the mean.
-
You can access the STDEVA function through the Formulas tab in Excel, by manually entering the formula, or by using the Insert Function button.
-
Important considerations when using STDEVA include handling errors, accounting for text and logical values, and understanding its use for sample standard deviation calculations.
Standard Deviation Functions
In 1983, Karl Pearson introduced the concept of standard deviation, the most important and widely used measure of variation. Standard deviation is a measure of the amount of variation or dispersion of a set of values and can be calculated either for the entire population or for a sample of data.

where:
- Xi: is each value from a population
- µ : is a population mean
- N : is the size of a population
And the following formula is used to calculate the sample standard deviation:

where:
- Xi: is each value from a sample
- X̄ : is a sample mean
- n : is the number of observations in a sample
Below is an example of a Sample Standard Deviation calculation. Let’s consider a fund with the following returns during the past 5 years:
| Year | Fund’s returns |
|---|---|
| 2018 | 16,2% |
| 2019 | 20,3% |
| 2020 | 9,3% |
| 2021 | -11,1% |
| 2022 | -17,0% |
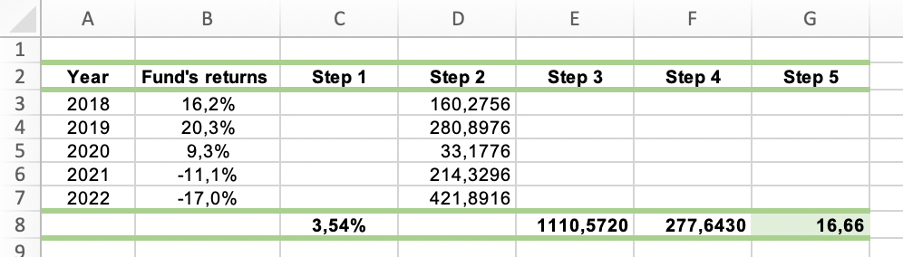
To calculate the sample standard deviation, the following steps have to be followed:
1. Calculate the sample’s mean:
(16,2 + 20,3 + 9,3 - 11,1 - 17,0) / 5 = 3,54
2. Calculate the squared deviations of each of the returns from the mean:
(16,2 - 3,54)2 = 160,2756
(20,3 - 3,54)2 = 280,8976
(9,3 - 3,54)2 = 33,1776
(-11,1 - 3,54)2 = 214,3296
(-17,0 - 3,54)2 = 421,8916
3. Sum the values of calculated squared deviations:
160,2756 + 280,8976 + 33,1776 + 214,3296 + 421,8916 = 1,110.5720
4. Divide the sum of the squared deviations from the mean by n-1, where n is the number of years:
1,110.5720 / (5 – 1) = 277,6430
5. Finally, calculate the square root of the value obtained in step 4:
√(2776430) = 16.66%
NOTE:
When the values tend to be close to the mean of the set, the standard deviation is low. Contrary, when the values are spread out over a wider range, the standard deviation is high.
How to Use the STDEVA Function?
There are three ways to access the STDEVA function in excel:
1. Formulas tab
First, you can utilize the Formulas tab and find the function under the Statistical category.
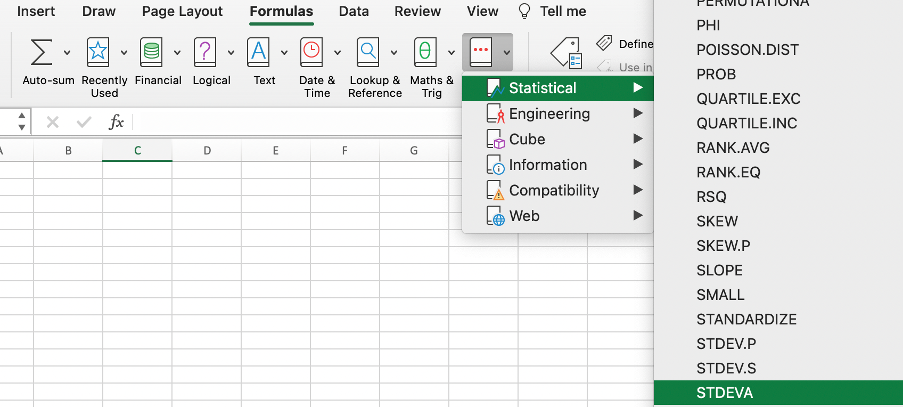
After you select the STDEVA function from the list, the formula automatically appears. All you have to do is to select the arguments needed for the function to operate correctly. These arguments will be covered below.
2. Entering Formula into the Worksheet
Alternatively, you can click on any cell in a worksheet and type the following formula:

where:
value1; [value2]; … – values 1 to 255 corresponding to a sample of a population.
Values can either be numbers, names, arrays, or references to values.
NOTE:
While value 1 is required, subsequent values are optional when using the formula.
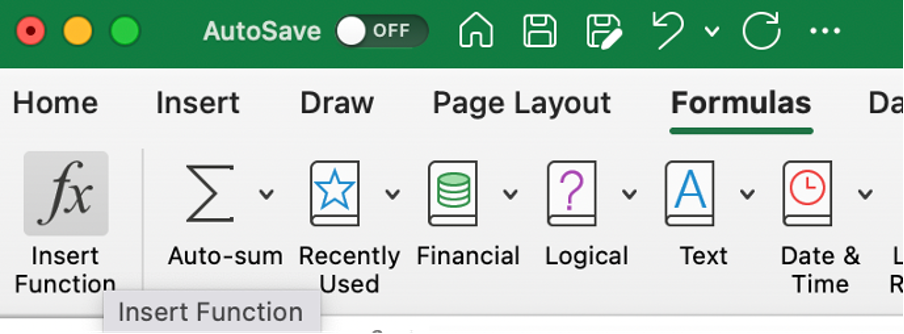
3. Utilizing the Formulas Tab with Manual Input
Finally, you can simultaneously utilize the Formulas tab and the manual input of the formula. Select any cell in a worksheet, continue to the Formulas tab, press the Insert Function button, and then start typing the formula.
Example: Consider the fund’s returns from the previous example. Only this time we are going to use the STDEVA function to calculate the sample standard deviation.
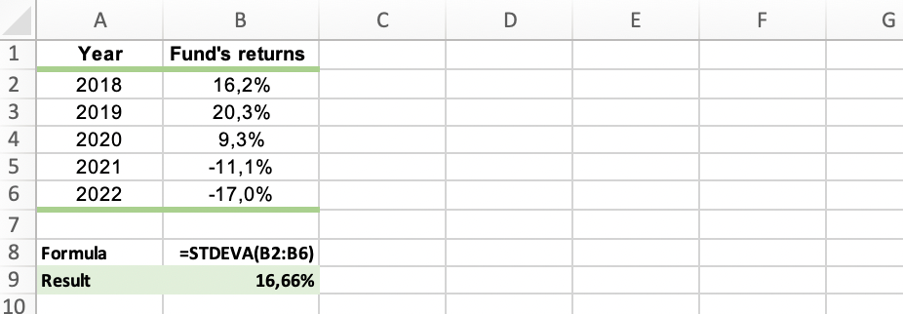
The result is the same as the one obtained using the manual calculation method.
Things to Remember When Using the STDEVA Function
Like with any other Excel function, some things need to be considered when using the STDEVA function. Failure to consider this information may result in receiving values that lead to an incorrect interpretation.
 The things to remember are:
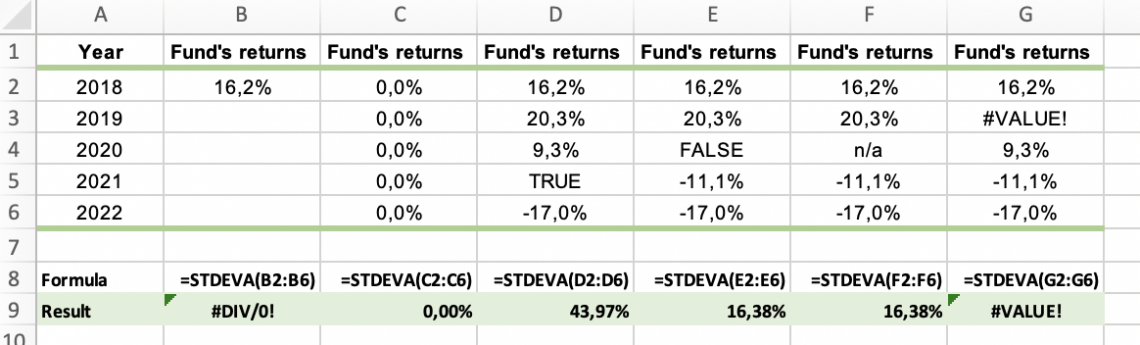
- If less than two values are inputted into the function, #DIV/0! Error will occur.
- #VALUE! Error occurs only when the values inputted into the function arguments are either error or text values that cannot be interpreted as numeric values.
- The STDEVA function considers text and logical values in a calculation. Therefore, you should use it when you need to evaluate text and logical values in a calculation.
- The function assigns a value of 0 to any text and a FALSE logical value, and a value of 1 to a TRUE logical value.
- The function calculates the sample standard deviation (using the "n-1" method). If your data represents the entire population, different functions (for example, STEVPA) should be used.
- Empty cells are ignored when using the function.
- If an argument is an array or reference, only values in that array or reference are used in the function.
- When you are working with a data set that only contains zero values, the function will return a standard deviation of 0.


or Want to Sign up with your social account?