WEIBULL.DIST Function
A statistical distribution that models the time-to-failure of a product or system


what is Weibull Distribution?
The Weibull Distribution is a statistical distribution that models the time-to-failure of a product or system. This flexible distribution can model many kinds of data, including increasing, decreasing, and constant failure rates.

It is a versatile distribution that can describe various shapes for the probability density function. These two parameters define the Weibull distribution:
- Scale: determines the scale of the distribution.
- Shape: determines its shape and can take on any positive value, and different values produce different shapes.
One of the main advantages of this distribution is its flexibility in fitting various data sets. The shape parameter can describe the influence of factors such as wear and tear, environmental stress, and aging.
Life data analysis uses this distribution to model systems' lifetimes where failure is expected.
It has several valuable properties, including closed-form expression for its cumulative distribution.
These expressions make it easy to compute essential parameters such as reliability, hazard rate and mean time to failure. Its flexibility and beneficial properties make it an important tool for researchers and engineers.
Its continued use and development ensure that it will remain a helpful tool for many 1 years.
The Weibull Distribution was first introduced in 1939 by Swedish engineer Waloddi Weibull.
- Weibull distribution is defined by two parameters which are scale (alpha) and shape (beta).
- It can be used to model the probability of failure over time.
- Excel contains several built-in functions that we can use with Weibull dist function, such as Weibull.inv and Weibull.test, which can be used to calculate probabilities and test whether a data set follows the Weibull distribution.
- Check if the data is appropriately transformed and formatted in ascending order.
- Choose appropriate values for shape and scale parameters based on the characteristics of the data.
What is WEIBULL.DIST Function in excel?
The WEIBULL.DIST Function is an Excel function that calculates the cumulative distribution function (CDF) or probability distribution function (PDF) of a Weinbull distribution for a given value.
As a financial analyst, the function helps model reliability and failure rates in various contexts.
For example, we can predict, "How many failures will occur in the next quarter?" or "What is the best action to reduce the risk and losses?"
Besides this, Excel also offers some other functions that perform reliability analysis.
- The "WEIBULL.INV" function calculates the inverse cumulative distribution function.
- The WEIBULL.HAZARD function calculates the hazard rate.
The formula/Syntax for the Weibull Distribution function in MS Excel is as follows:

Where parameters of Weibull dist are:
- x: The value for which you want to calculate the distribution.
- alpha: This is the scale parameter of the distribution.
- beta: This is the shape parameter of the distribution.
- cumulative: This is a logical value that determines the form of the distribution.
- TRUE : The function returns the cumulative distribution function.
- FALSE : The function returns the probability density function.
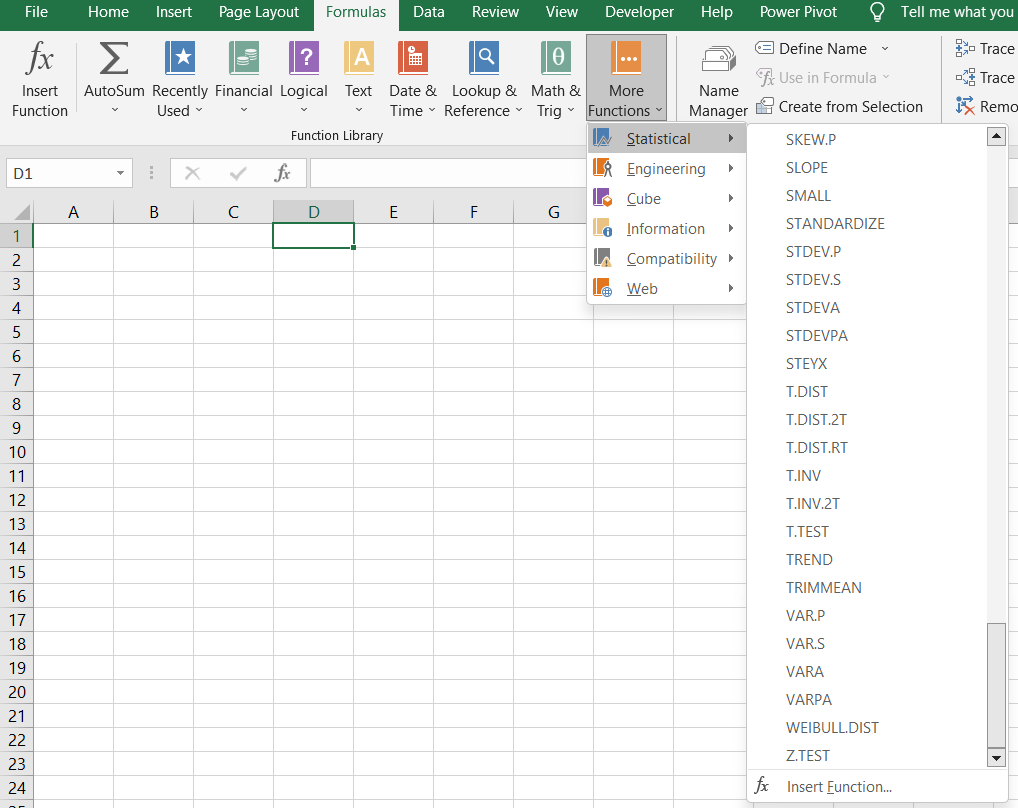
Weibull distribution and WEIBULL Distribution Function
The function is in the formula bar under statistical functions.
The function takes three inputs: the first value is the least, the second is average, and the third is the greatest.
Two parameters characterize this function,
- scale(alpha) and
- shape(beta).
The scale parameter determines when a significant amount of the population will fail.
The shape parameter determines the rate at which the failure rate changes with time.
The function then calculates the probability that the value will be less than or equal to a given value. This function models the lifetime of a product or the time until the failure of a system. This function makes calculating probabilities and other essential statistics easy.
To plot Weibull distribution in Excel, we need to generate a set value representing the possible failure times and a set of y values representing a probability density or cumulative distribution function at each time.
How to use the Excel WEIBULL Distribution Function
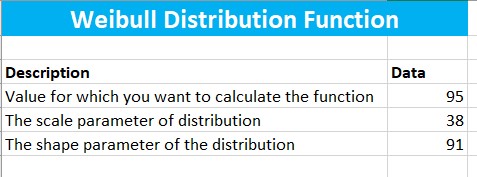
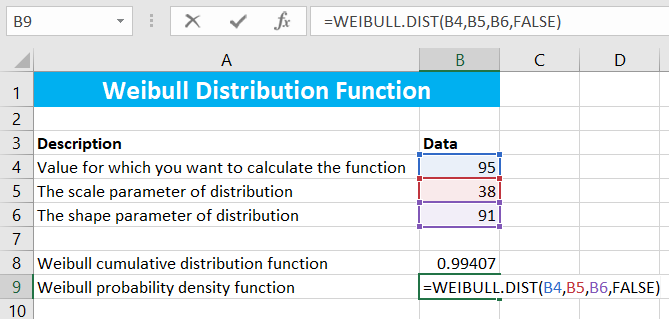
Let's take an example where the value for which we want to calculate the function, i.e., x, is 95, and the scale and shape parameters of the Weibull distribution are 38 and 91, respectively.
We will now open a new spreadsheet in MS Excel and put the above-given data in the spreadsheet, and format the data as given below.
Now that we have put the data in the spreadsheet and prepared a proper format, it is time to calculate the cumulative distribution function using Excel.
To calculate CDF, we will make a separate cell and use the Weibull distribution function as given below.
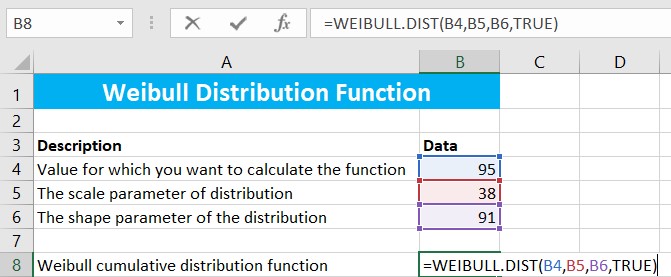
We have taken the cumulative function as "True," giving us a Weibull cumulative distribution function.
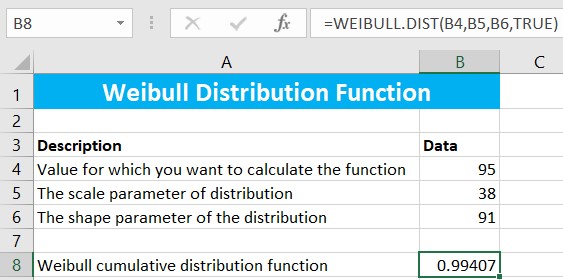
After inputting all the necessary parameters of the formula, Excel will help us calculate the cumulative distribution function(CDF) of the given Weibull distribution.
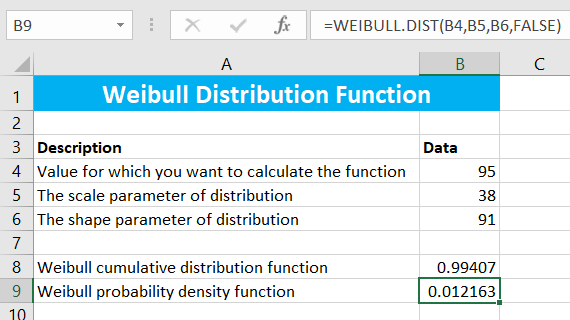
Now that we have seen an example of the cumulative distribution function, let's calculate the probability density function(PDF) of the same data.
All the steps will be the same, except using the "False" function in cumulative, which will give us the probability density function of the given Weibull distribution as given below.
After clicking the enter key, we will get our probability density function. You can change the parameters and see the results yourself.
WEIBULL Distribution Function Errors
We can come across different errors while calculating this function in MS Excel; these errors can be due to various reasons. Some of the most common mistakes are
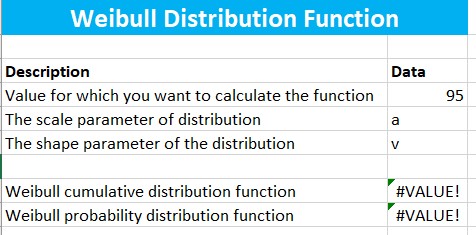
1. #Value! Error
This error occurs when the value of x, alpha, or beta is non-numeric.
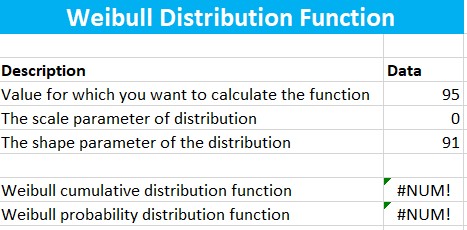
2. #Num! Error
This error occurs when the value of x < 0, alpha ≤ 0, or beta ≤ 0.
3. Invalid Argument Error
This error occurs when one or more arguments for this distribution are invalid.
4. Inconsistent Formula Error
This error occurs when the formula for calculating this distribution needs to be consistent or valid.
If your function has any of these errors, please check for the values of your parameters x, alpha, and beta or recheck your formula. It is better to avoid these errors by ensuring the values you put for the function are correct, and the procedure is appropriately constructed.
We recommend using the Excel function wizard to ensure the arguments are given correctly and the formula is correctly used.
How do I fit a Weibull distribution to data in Excel?
We can calculate the cumulative distribution function and probability density function of a Weibull distribution by fitting them to data in Excel.
Weibull distribution is a family of distributions parameterized by shape parameters(Beta). We can fit the distribution to Excel data by estimating the distribution's shape and scale parameters.
Here are the steps you can do in Excel:
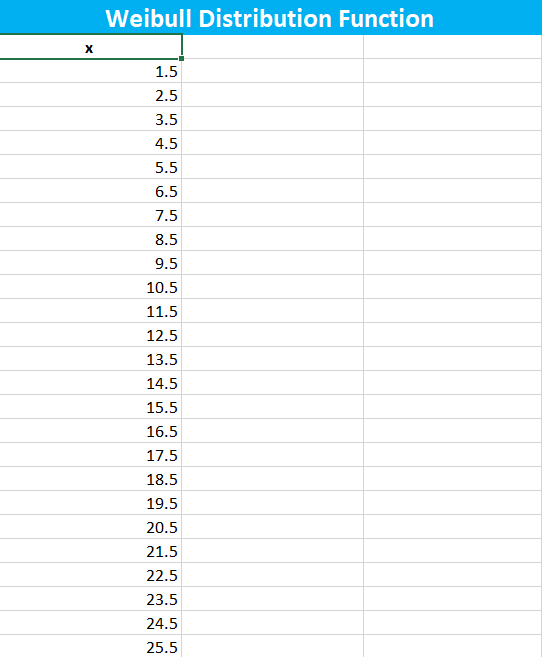
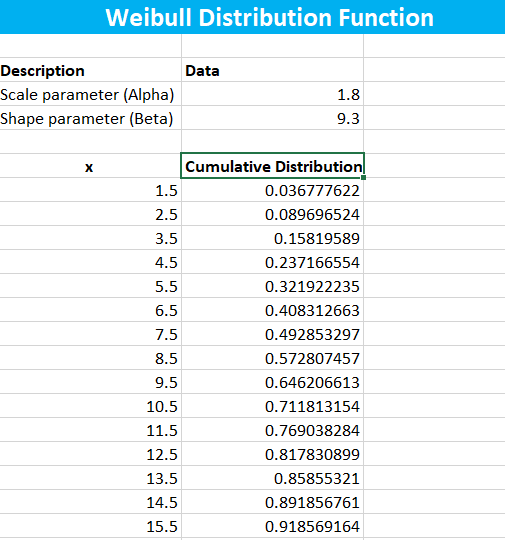
1. Prepare your data, input it in the new Excel worksheet, and ensure it is in ascending order as given below.
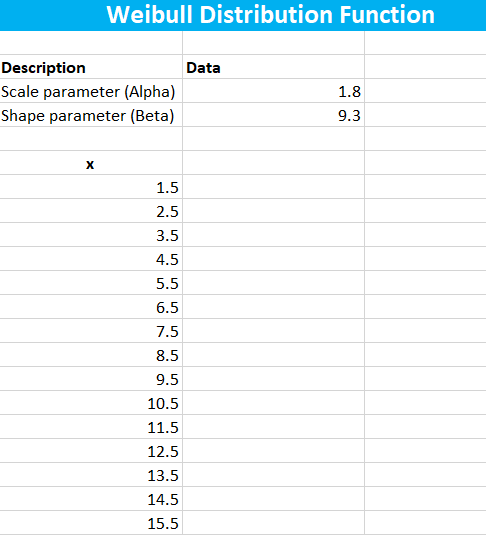
2. Estimate the scale and shape parameters, i.e., alpha and beta, based on the characteristics of your data.
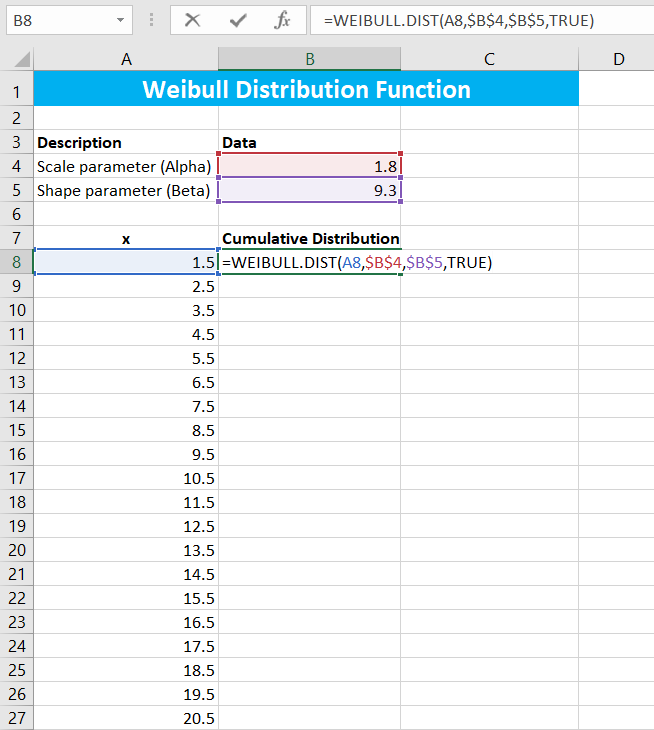
3. Now make a column of Cumulative Distribution adjacent to the column of x and put in the formula for Weibull cumulative distribution function.
4. Calculate the cumulative distribution for all the values of x.
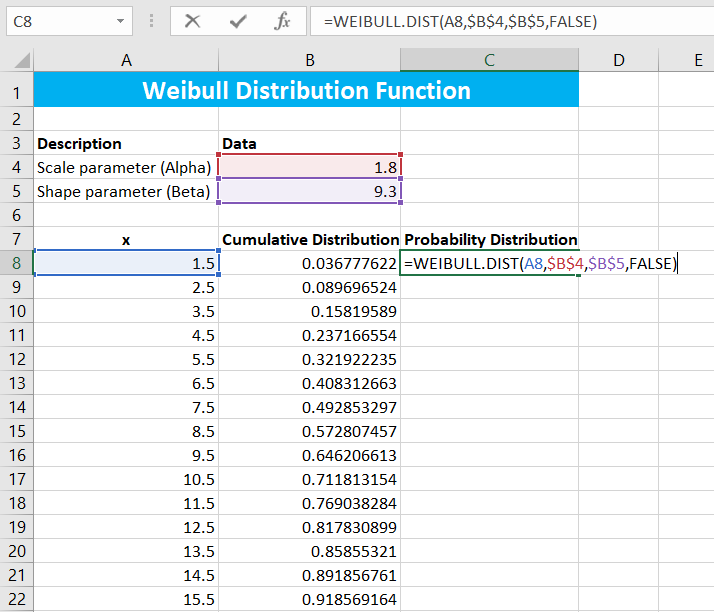
5. Make a Probability Distribution column adjacent to the cumulative distribution column and put it in the formula.
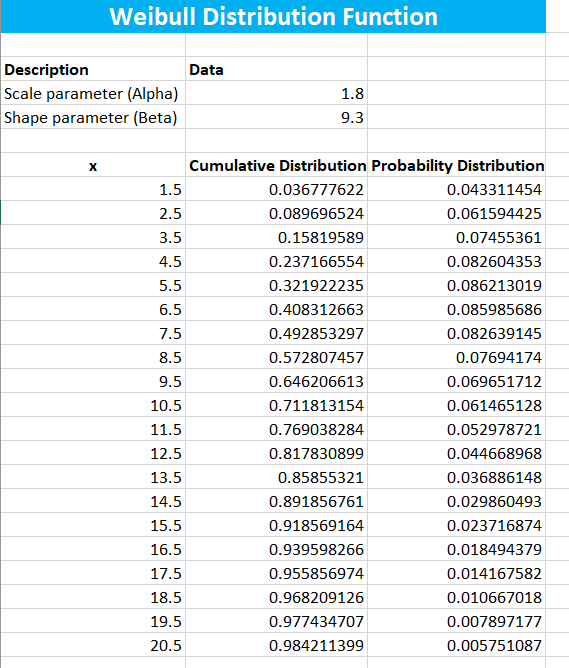
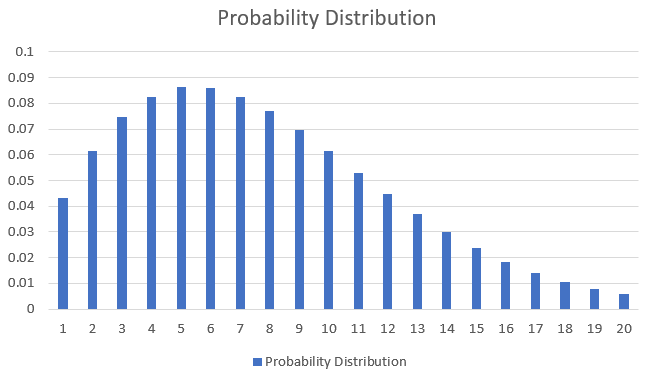
6. After calculating the probability distribution for all the values of x, the dataset will look like this.
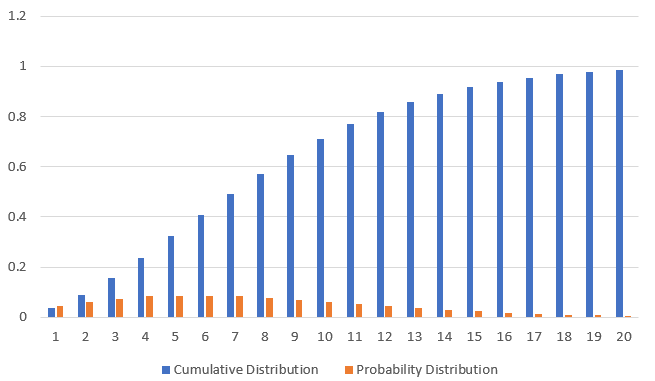
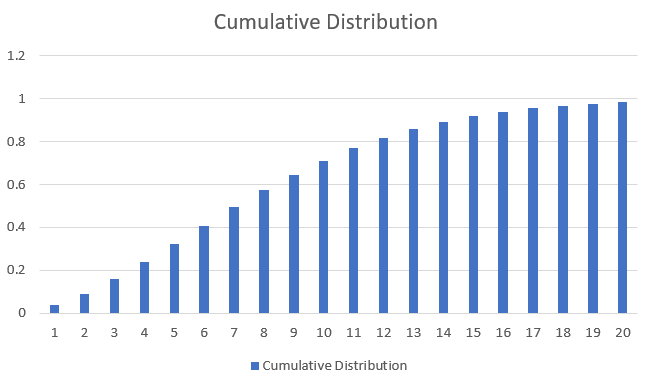
7. Now, let's graph the following data to understand it visually.
- Graph of Cumulative distribution of the above-calculated data.
- Graph of the Probability distribution of the above-calculated data.
Now try making a Weibull distribution yourself and estimate its scale and shape parameters based on the character of the dataset.
You can also try tweaking the above data's scale and shape parameter values and see how graphs change with the increase or decrease in parameters.


or Want to Sign up with your social account?