VBA: How to Debug Code
It enables the detection and correction of code mistakes


VBA: How to Debug Code?
Debugging is an essential component of VBA programming. It enables the detection and correction of code mistakes.

Microsoft Excel, first made available in 1985, was the inspiration for VBA debugging. Users may automate processes and carry out sophisticated calculations using Excel's VBA.
VBA code was yet susceptible to flaws. Like any programming language, it could result in inaccurate outcomes or even crashes.
Mastering the fundamentals of debugging is crucial for advancing your coding abilities. We will examine the principles of debugging in VBA in this post, along with its significance, resources, and methods.
In VBA, debugging entails finding and repairing code issues. Many factors can lead to errors, including syntax problems, runtime issues, and logic flaws.
Debugging the code allows you to find these flaws and correct them before they have an impact. Debugging is crucial since it might help you save time and effort in the long term.
You must enable the VBA debugger in the VBA editor before configuring it. To do this, select Settings from the Tools menu, check the box next to "Break on All Errors," and click OK.
This setting guarantees that the debugger will stop whenever a programming error occurs. Another effective method for debugging VBA code is breakpoints. They enable you to halt the execution of the code and check the values of variables or objects at particular intervals.
- Debugging is vital in VBA programming, allowing for the detection and correction of code errors.
- Microsoft Excel served as the inspiration for VBA debugging, enabling automation and complex calculations.
- Mastering debugging fundamentals enhances coding skills and saves time and effort in the long run.
- Techniques such as breakpoints, stepping through code, and monitoring variable values are effective in VBA debugging.
- Different VBA environments like Excel, Access, Word, PowerPoint, and Outlook offer specific debugging tools for efficient code troubleshooting.
Techniques and tools used in debugging
A helpful method for analyzing VBA code is stepping through the code. One line of code is executed at a time, enabling you to track the execution route and spot any problems.

Monitoring variable values and evaluating expressions are made easier using the Locals and Immediate panes.
The Immediate window enables you to run code and test expressions. At the same time, the Locals window displays the current values of all variables in the active method.
Debugging techniques include descriptive variable names, incorporating error handling, and testing code in small chunks.
When an error occurs, error handling is essential for keeping the code from crashing. The code is simpler to understand, and mistakes are simpler to spot when variables have descriptive names.
Note
You can more simply and quickly spot bugs by testing code in small batches.
Watching expressions, using the Call Stack window, and examining memory use are advanced debugging methods in VBA.
You can keep track of particular variables or expressions. They change while the code is being executed by using watching expressions.
The Call Stack pane displays the sequence in which processes are called, making it easier to spot potential error sources. Monitoring memory use can assist in locating problems with performance or memory.
More methods and tools could be necessary while debugging VBA code in particular settings, such as Excel or Access.
For instance, you may monitor certain cells or ranges using Excel's Watch feature. In addition, the Object Browser in Access can look up an object's methods and properties.
Debugging is an essential component of VBA programming, to sum up. It aids in finding and fixing coding problems, enhancing the usefulness and efficiency of the code.
You can become a better VBA developer and raise the level of your code by utilizing the methods and tools covered in this article.
Note
Don't forget to use error handling, test your code in small increments, and use the many VBA debugging tools.
Setting up the VBA debugger
Setting up the VBA debugger is a crucial step in learning how to write with VBA since it enables you to find and correct code issues.
You can use the debugger to investigate the values of variables, objects, and expressions by stopping the execution of the code at certain moments. In this tutorial, we will go into great depth on how to set up the VBA debugger.
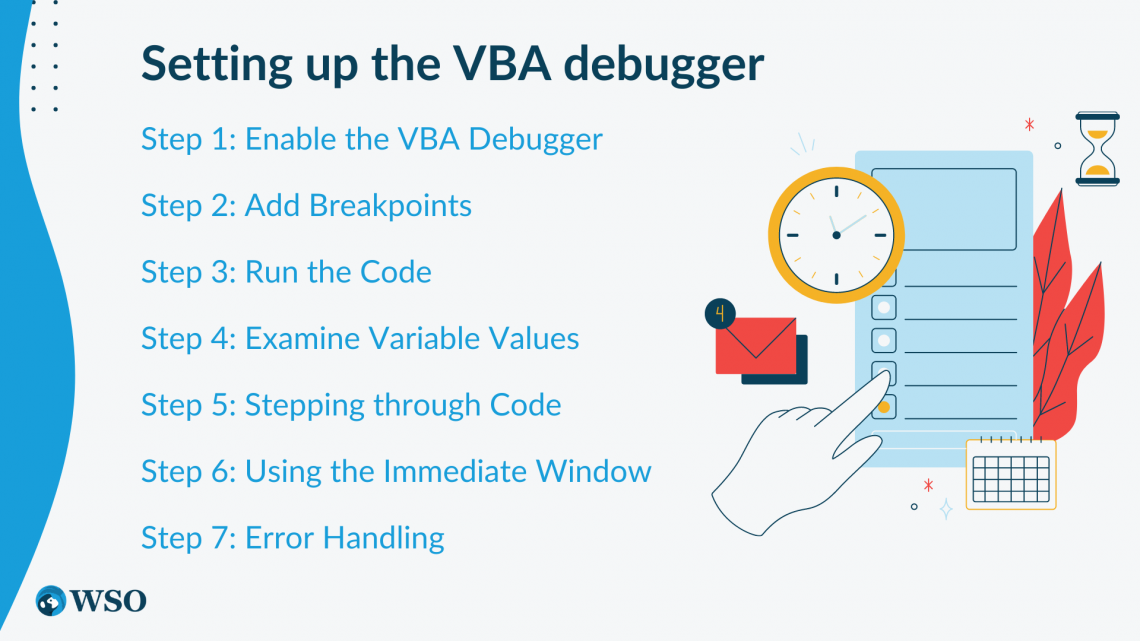
Step 1: Enable the VBA Debugger
Enabling the VBA debugger in the VBA editor is the first step in configuring it. You must choose Options from the Tools menu to accomplish this.
Check the box next to "Break on All Errors" in the General tab of the Options dialogue box. This setting guarantees that the debugger will terminate whenever a programming error occurs.
Step 2: Add Breakpoints
Another helpful technique for debugging VBA code is breakpoints. They enable you to halt the execution of the code and check the values of variables or objects at particular intervals.
Click on the line of code where you wish to halt the execution, then press F9 to add a breakpoint. You can also choose "Toggle Breakpoint" from the context menu when you right-click the line of code.
Step 3: Run the Code
You can run the code after setting up the VBA debugger and adding breakpoints. Press F5 or choose the Run option in the VBA editor to accomplish this.
Unless it reaches a breakpoint or runs into an error, the code will continue to run.
Step 4: Examine Variable Values
You can check the values of variables or objects in the Locals pane when the code reaches a breakpoint. The current values of each variable used in the active procedure are displayed in the Locals window.
Note
Hovering the mouse over a particular variable or expression in the code or typing it into the Immediate window will also reveal its value.
Step 5: Stepping through Code
A helpful method for troubleshooting VBA code is stepping through the code. One line of code is executed at a time, enabling you to track the execution route and spot any problems.
You can walk through the code by pressing F8 or the Step Into button in the VBA editor.
Step 6: Using the Immediate Window
A useful tool for evaluating variable values and testing expressions is the Instant window.
You can access the Immediate window by hitting Ctrl + G or by choosing Immediate Window from the View menu. In addition, you can run code and test expressions in the Instant window.
Step 7: Error Handling
When an error occurs, error handling is essential for keeping the code from crashing. With the On Error statement, you may add error management to your code.
You can indicate what should happen when an error arises using the On Error statement, such as displaying a message or logging the error.
In conclusion, the VBA programming process must start with the VBA debugger setup. It enables you to locate and correct code mistakes, enhancing its usability and efficiency.
You may successfully set up the VBA debugger and use it to debug your code by following the instructions provided in this article.
Note
To stop the code from crashing, don't forget to set breakpoints, inspect variable values, and employ error handling.
Best practices for debugging VBA code
Programming with VBA requires debugging VBA code. Thus best practices must be followed to enable successful and quick debugging.
The best approaches for debugging VBA code will be discussed in this article to assist you in finding and fixing code faults.
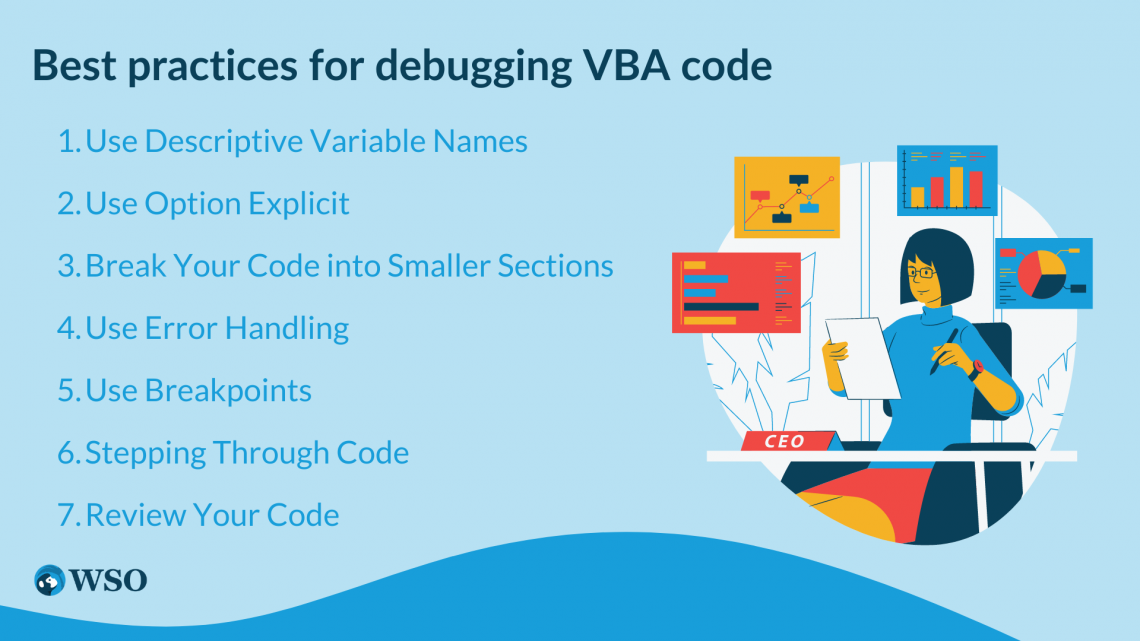
- Use Descriptive Variable Names
The function of each variable in your code can be more recognized and understood if you give them descriptive names.
This makes it simpler to pinpoint which variable might be the source of an error, which is useful for debugging your code.
- Use Option Explicit
To ensure that all variables used in your code are declared, use Option Explicit at the beginning of your code.
By doing this, it is possible to avoid typos and other problems when using undeclared variables.
- Break Your Code into Smaller Sections
It may be simpler to locate an error if your code is divided into smaller portions.
You can reduce the number of potential mistakes caused by isolating particular portions of your code. It will make it simpler to discover and solve the error.
- Use Error Handling
When an error occurs, using error handling can assist in keeping your program from crashing.
Although it might be challenging to pinpoint the exact location of a mistake, this can be especially helpful when working with big and complicated codebases.
- Use Breakpoints
Breakpoints make it possible to halt the execution of your code at particular points, making it simpler to check the values of variables and expressions there.
This can be helpful when you need to locate an error or check the values of particular variables while the code is executed.
- Stepping Through Code
By running your code one line at a time while stepping through it, you can check the execution path and see mistakes more easily.
Note
This technique might be extremely helpful when working with sophisticated code that can have several potential error reasons.
7. Review Your Code
You can find potential errors before they arise by reviewing your code.
This can entail proofreading your code for errors, testing the consistency of your variable names, and ensuring your code follows VBA's best programming principles.
Finally, you can quickly and effectively find and correct code faults by adhering to standard practices for debugging VBA code. For example, you can identify potential issues and pinpoint their origins using descriptive variable names, Option Explicit, error handling, breakpoints, and walking through code.
Reviewing your code can also find any mistakes before they happen, ensuring it functions correctly and effectively.
Debugging code in specific VBA environments such as Access or Excel
Understanding how the VBA debugger functions in each environment is necessary when debugging code in certain VBA environments like Access or Excel.
The following advice can be used to debug code in particular VBA environments:
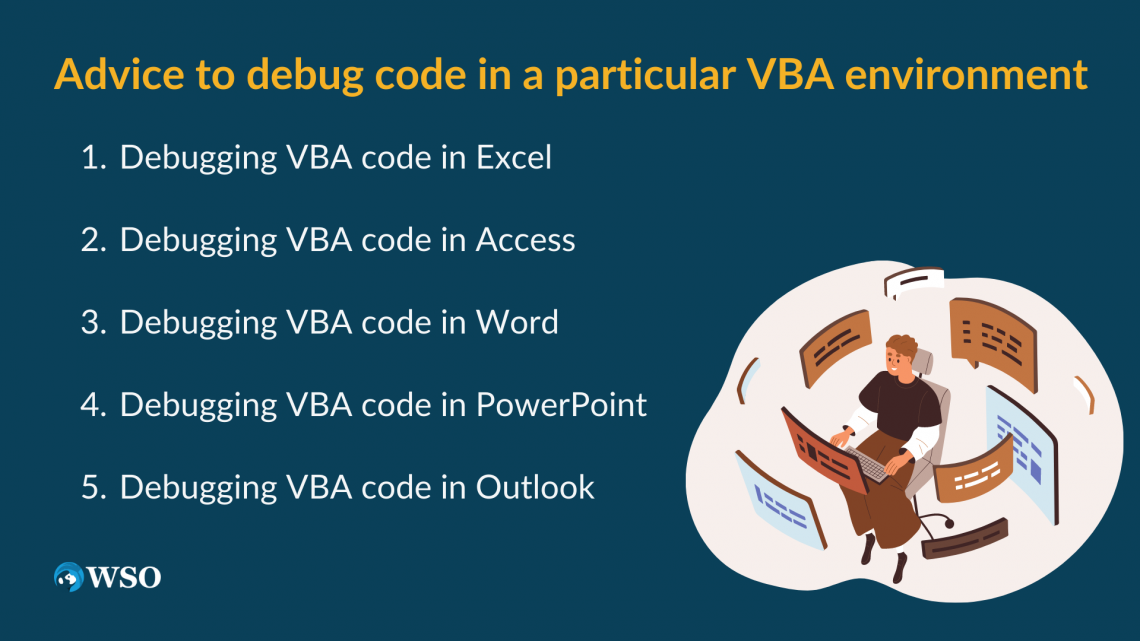
- Debugging VBA code in Excel
With the built-in VBA debugger in Excel, you can troubleshoot VBA code. The "Debug" button in the VBA Editor or the F5 key can launch the debugger.
You can also check the values of the variables in your code by using debugging tools designed specifically for Excel, like the "Locals" pane.
- Debugging VBA code in Access
The built-in VBA debugger is available for debugging VBA code in Access. The "Debug" button in the VBA Editor or the F5 key can launch the debugger.
To test and debug particular sections of your code, you can also use Access-specific debugging tools, such as the "Immediate" window.
- Debugging VBA code in Word
With the built-in VBA debugger in Word, you may troubleshoot the VBA code. The "Debug" button in the VBA Editor or the F5 key can launch the debugger.
To keep track of the values of the variables in your code, you can also use Word-specific debugging tools, such as the "Watch" window.
- Debugging VBA code in PowerPoint
With the built-in VBA debugger in PowerPoint, you can debug VBA code in presentations. The "Debug" button in the VBA Editor or the F5 key can launch the debugger.
Note
You can test and debug particular sections of your code using debugging tools designed specifically for PowerPoint, like the "Immediate" panel.
5. Debugging VBA code in Outlook
The built-in VBA debugger is available for debugging VBA code in Outlook. The "Debug" button in the VBA Editor or the F5 key can launch the debugger.
You can also check the values of variables in your code by using debugging tools native to Outlook, including the "Watch" pane.
It's crucial to debug your code in each context using the environment's unique debugging tools. By familiarizing yourself with these tools, you can easily find and correct any problems in your VBA code.
VBA: How to Debug Code FAQ

The built-in VBA debugger in Excel can be used to debug VBA code. The "Debug" button in the VBA Editor or the F5 key can be used to launch the debugger.
You can either click on the line number in the VBA Editor where you wish to put the breakpoint or hit the F9 key to establish breakpoints in the VBA code.
The code will halt when it reaches the breakpoint, allowing you to look up the values of variables and expressions.
You can add a line of code that outputs the value of a variable or expression to the Immediate Window to use Debug.Print in VBA. For instance, to output the variable "x" value to the Immediate Window, use "Debug.Print x".
Use error handling statements like "On Error Resume Next" or "On Error GoTo" in VBA, to deal with this issue. With the help of these statements, you may gracefully handle errors and stop them from delaying the operation of your code.
With the Step Into command, which enables you to run your code line by line, you can walk through VBA code. To step through your code, press the F8 key or choose "Debug" > "Step Into" in the VBA Editor.


or Want to Sign up with your social account?