Beta Coefficient
Describes an asset's volatility or systematic risk compared to the overall market


What is Beta Coefficient?
Beta describes an asset's volatility or systematic risk compared to the overall market. As one of the five technical risk ratios, beta is described as a beta coefficient determined by regression analysis.
In a capital asset pricing model, Beta is used to show how an asset's performance compares to that of the market, e.g., an asset with a beta of 2 will always perform twice as well as the market (10% market rise = 20% asset rise, 5% market fall = 10% asset fall). When Beta is higher than the overall market, it signals higher returns and higher risk.
The Beta Coefficient relates to the stock market by
-
Investors use the beta coefficient to measure your stock's risk compared to the overall market risk.
-
The beta coefficient of 1 represents the market's volatility. When a stock has a coefficient of 1, it will move with the market in terms of risk and volatility. If a stock has a Coefficient of less than 1, this would indicate that the stock would have a more stable return than the market.
-
For example, Apple Inc. stock (AAPL) has a beta coefficient of 1.19, which means that compared to the market beta of 1, Apple has a +0.19 more volatile risk and thus would be more volatile than the market by that margin, which could lead to higher gains or losses.
-
A positive beta means that the assets move along with the market, while a negative beta indicates the opposite and travels against it.
-
In a riskless investment, such as a Government T-bill, the Beta Coefficient rests at 0. Based on the name, you can guess why it rests at 0; yes, that's right, no risk!
So in more general terms, the Beta Coefficient usually has a range of 0-1+. It would help if you always viewed a Beta of 1 as the neutral point in volatility since it equals the market. So any less or more gives you a good idea of whether your investment will have more or less risk.
However, in some cases, a stock's Beta is less than 0, which would indicate an inverse relation to the market, as mentioned above, is possible but highly unlikely to occur.
As a general rule of thumb, the greater the risk on an investment, the greater the rewards & losses.
Let's look at one way of calculating Beta below. First, notice how the Beta is calculated using the expected return from your investment, the expected market return, and the risk-free return. To fully understand these, we will look over the steps of finding your expected returns.
𝛃 = E (rs) - rf / E (rm) - rf
- 𝛃 = Beta for your investment
- E (rs) = Expected return from your investment
- E (rm) = Expected return from the market
- Rf = Risk-free Return
- Beta coefficient measures an asset's volatility or systematic risk compared to the overall market. A higher beta indicates higher returns and higher risk, while a lower beta suggests more stable returns.
- Beta coefficient of 1 represents the market's volatility. A stock with a coefficient less than 1 is considered less volatile than the market, while a coefficient greater than 1 indicates higher volatility.
- A positive beta means the asset moves along with the market, while a negative beta suggests an inverse relationship with the market.
- Risk-free rate refers to an investment with no associated risk, typically government T-bills. It serves as a benchmark for assessing the risk and return of other investments.
- Diversification is a strategy that helps reduce unsystematic risk by spreading investments across different asset types or industries. Beta coefficient is used to calculate portfolio beta, which considers the weighted average of individual asset betas.
What are Expected Returns?
This scenario shows us the process of getting the expected return of security B (stock B):
| Scenario | Probability (P) | Return (R) | P x R | Expected Return |
|---|---|---|---|---|
| Worst | 0.35 | -2% | -0.70% | |
| Moderate | 0.35 | 12% | 4.20% | 8.90% |
| Best | 0.3 | 18% | 5.40% |
-
In the scenario section, three possible worst, moderate, and best states represent possible outcomes for that security. Remember, this is the "expected" return, so we base it on probabilities rather than just historical data.
-
The probability section indicates three probability values representing how much of that scenario is probable. Notice how the probability adds up to 1 (0.35 + 0.35. 0.3 = 1). This should always be the case to ensure the calculations are correct.
-
In the return, section are the returns that would fit best with each scenario/state. The expected return is found by multiplying each probability by their return in each state and adding them all together ((0.35 x -0.02) + (0.35 x 0.12) + (0.3 x 0.18) = 0.0890 or 8.90%)
The expected return functions to find the variance and standard deviation to determine the asset's risk. This part will not be covered in this section.
Example of Expected Returns
There are two securities, Mcdonald's stock & Wall Street Oasis security, with returns of -8%, 5%, and 13% for A and -4%, 5%, and 17% for B.
There are three worst, good, and best states, with the probabilities being 0.2, 0.5, and 0.3, in the same order as the returns. Which asset has a greater expected return?
Answer:
Mcdonald’s Stock: (0.2 x -0.08) + (0.5 x 0.05) + (0.3 x 0.13) = 0.048 or 4.8%
Wall Street Oasis Security: (0.2 x -0.04) + (0.5 x 0.05) + (0.3 x 0.17) = 0.068 or 6.8%
Wall Street Oasis has a greater expected return.
What is Risk-free return/rate
The risk-free rate is an investment with no risk associated with it. These usually are government T-bills or other long-term government bond yields. The reason is that the government can always raise taxes to pay its bills which makes it free from any default risk.
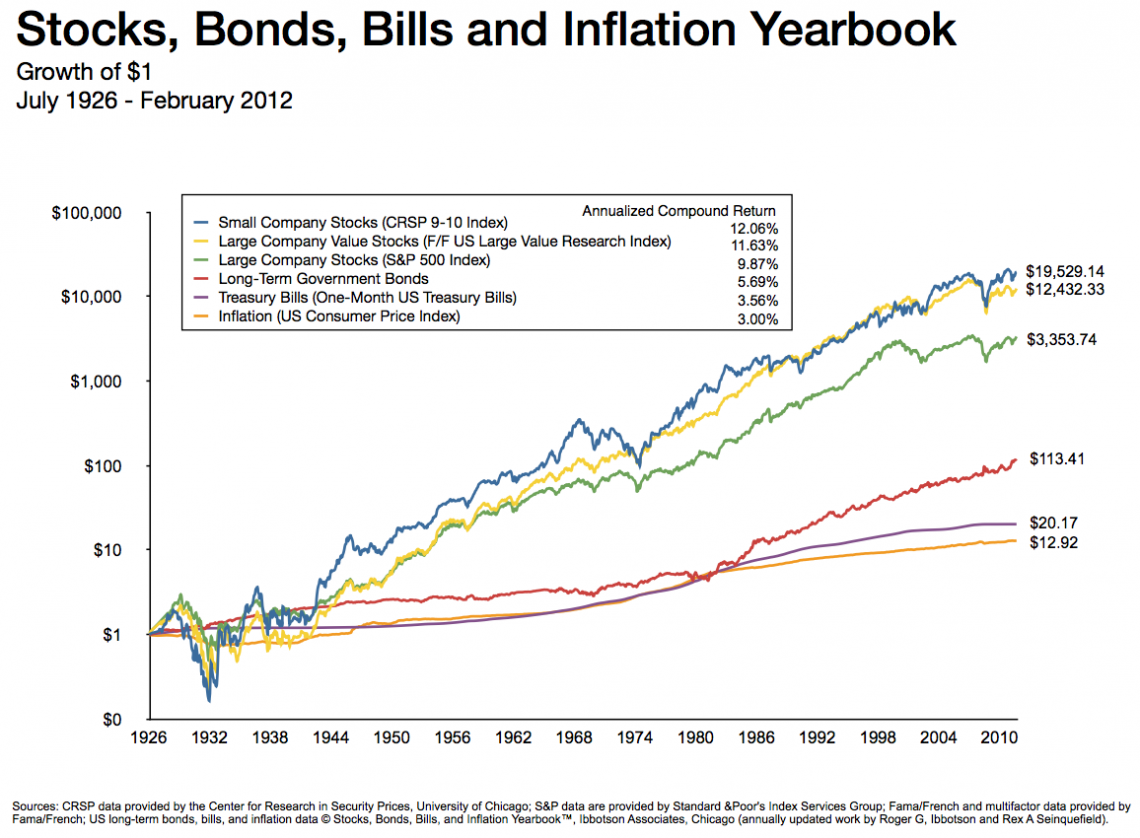
Based on the graph above, notice how the government T-bill has the lowest return value from a 1-dollar investment from 1926 to 2010. This is because government security bears no risk and, in response, bears little returns.
However, notice how the Treasury Bill has the smoothest figure compared to any other market, such as the Small Company Stocks. This also represents that a riskless investment will ensure almost no loss risk.
A method for investors to see how much risk they take on investment is finding the risk premium. This is done by subtracting the security's average return (arithmetic or geometric) and the riskless rate (Government Treasury Bills).
For example:
- Notice the section at the top in the legend where they calculated the annualized compounded returns.
- The risk premium of Small company stocks (purple line) is 12.06%, and the Government T-Bill is 3.56%, so the risk premium is 12.06% - 3.56%= 8.5%. In other terms, it is 8.5% riskier to invest in small company stocks.
- Expected Market Return is finding the expected return for your portfolio. This is done using portfolio weights and the probabilities and returns in each state. This will not be covered.
How to calculate Beta
Now that we know how to calculate the expected return and what a riskless rate is, let's look at how to find the Beta when given the expected market return.

While using our Beta coefficient formula from above:
Suppose you are looking for a Beta of at least 1.05 on investment at Wall Street Oasis. The government is setting the T-Bills at 3.12%. The expected market return is 10.59%, and the expected return on security at Wall Street Oasis is 14.15%. Should you invest in this asset?
Answer:
Beta = (0.1415 - 0.0312)/ (0.1059 - 0.0312) = 1.47
You should invest in Wall Street Oasis since 1.47 is more significant than 1.05.
Changing from the previous question, suppose you have an average return of 9.12% in Security A with a Beta of 0.53. Unfortunately, the return for the government T-Bill has been torn off by your dog because you were day trading and you forgot to feed him.
All you have is the risk premium of 5.40% for security A. What is the expected market return?
Answer:
a) 9.12% - 5.40% = 3.72%
My riskless return rate for the government T-Bill is 3.72%
b) (0.0540/0.53)x100) - 0.0372 = 6.47%
The expected market return is 6.47%.

Systematic & Unsystematic Risk (effects of diversification)
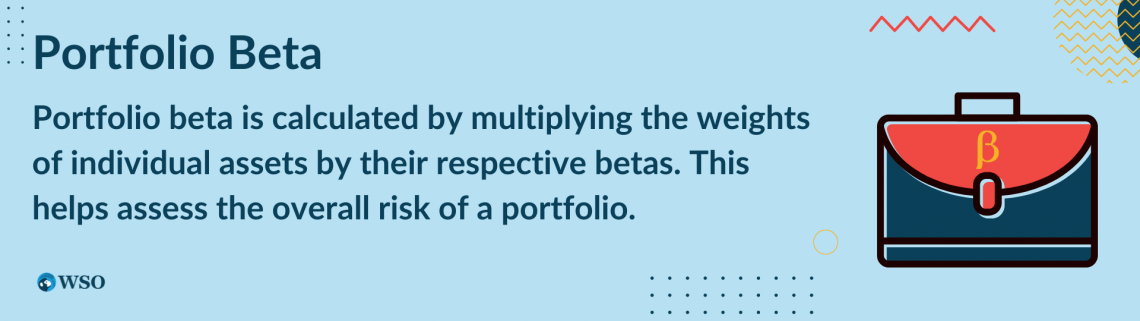
So now we know how to calculate Beta for a stock. Portfolio betas are found by multiplying the portfolio weight of a particular asset by its Beta and adding them together.
So if I have 50% of my money in asset A with a Beta of 1.2 and 50% in asset B with a Beta of 0.9, then my portfolio 𝛃 is = (0.5 x 1.2) + (0.5 x 0.9) = 1.05.
Now let's take a step back and first look at why Beta is even used when we want to assess the risk of an investment.
-
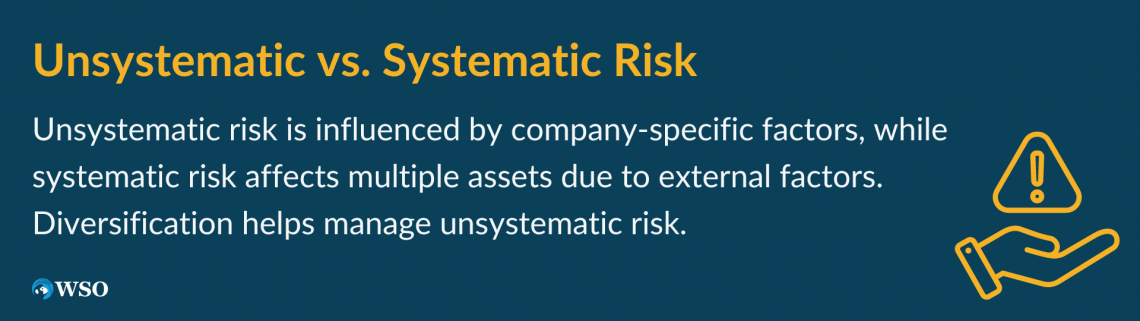
Unsystematic risk: is the portion of the risk in an investment that is impacted based on the company's decisions or announcements, affecting only a single asset or a small group of assets.
-
Systematic risk: is the other portion of the risk in an investment that affects many assets. Includes changes to interest rates, inflation, GDP, etc.
Diversification is a method of managing risk by mixing a variety of investments within a portfolio. Diversified portfolios contain various asset types and investment vehicles to minimize exposure to any single asset or risk.
This method is based on the idea that a portfolio constructed of different types of assets will, on average, produce higher long-term returns and lower the risk of any particular investment.
The effects of diversification involve an investment in several different security industries/classes. This means investing in many different categories, such as energy, technology, entertainment, etc., rather than investing in 50 assets from the same industry.
By diversifying your investments, you reduce the variability of returns without an equivalent reduction in expected returns.
Diversifying your capital aids in reducing unsystematic risk; however, there will always be a systematic risk in the stock exchange market, and you guessed it! That portion is found by calculating the beta coefficient.
The systematic risk principle indicates that the forecasted return on a security's risk depends only on that security's systematic risk. Therefore, it is crucial to understand how the beta coefficient functions.
Quick Pop Question!
Your broker gives you three options. First is to invest 80% of your investment equity into one security and 20 % into a mutual fund.
The second is to invest 50% of your investment equity into multiple different funds and 50% in one stock. The third is to invest 70% of your equity in many other stocks and 30% in your savings with interest.
Answer: The last option is the answer, diversifying your portfolio into many different sectors dramatically diminishes the risk. If 70% of your equity is diversified and 30% placed into your savings, your portfolio looks lovely. Good job!

Finding Beta Coefficient using the covariance and variance of assets
So far, we have seen how to calculate Beta using expected returns. Now let's discuss another approach that is generally simpler to calculate.
𝛃 = CoVariance(rp, rb) / Variance(rb)
Based on this formula, you can see the covariance between a stock and the market (rp, rb) divided by the variance of the market. I will explain these terms briefly but not to the full extent. First, this formula can be interpreted differently to make it simpler.
𝛃 = CoVariance(rp, rb) / Variance(rb)
Now, ρxy = CoVariance(rp, rb) / σx σy
Which means 𝛃 = ρxy, σx/σy
- ρxy = correlation coefficient of X & Y
- σx = standard deviation of stock X
- σy = standard deviation of the market
In the formula above, notice how the Beta coefficient is calculated using the correlation coefficient of X & Y. This indicates the correlation coefficient between stock Y and the market portfolio of X.
On the numerator is the standard deviation of the stock X, while on the denominator lies the standard deviation of the market.
Quick note
The standard deviation of a stock means the stock's overall risk and how volatile the returns disperse from its average return.
So the higher the standard deviation on a stock, the riskier it is to invest in because it can have a far-off return from its calculated average return. In contrast, the opposite happens when it's lower.
The covariance between stocks or the market shows how both vary, so when stocks move with each other, they have positive covariance.
In contrast, if they moved against each other, they would have a negative covariance. It shows us the relationship between two variables when one of the changes.
The correlation between stocks is similar to covariance but not the same. The correlation shows how the returns on two assets move together.
If the correlation is positive, two stocks move in the same direction and move in opposite directions when the correlation is negative.
A perfect positive correlation is set at one while the perfect negative correlation lies at -1, which means correlations are assessed based on where they vary between -1 and 1. Zero correlation means there is no correlation and is set to 0.
Now that we're caught up,
Let's practice: Use the formula above. The correlation between fund A and the market is 0.45, fund A has a standard deviation of 15.50%, and the standard deviation of the market is 12%. What is the Beta coefficient of security A?
Answer:
𝛃 = (0.45 x 0.1550) / 0.12 = 0.58
If you need more practice on this material, this video explains the process perfectly.
Capital Asset Pricing Model (CAPM) & Security Market line (SML)
In basic terms, the Security Market Line is a positively sloped straight line that shows the relation between the expected return and the beta coefficient.
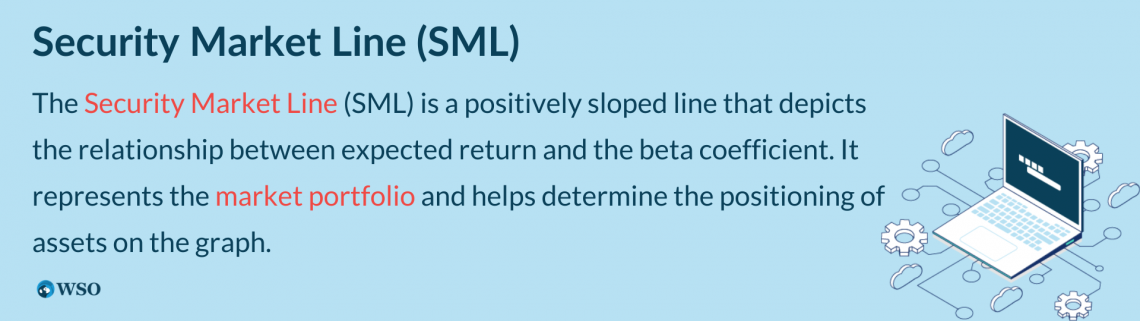
All the assets in the market portfolio (a portfolio with many diversified securities) are plotted on the security market line. To determine where they are plotted on the graph, the market portfolio needs the Beta.
The Security Market line slope (SML) = E(RM) - RF is similar to what we have already seen with the risk premium. The riskless rate subtracted by the expected market portfolio gives us the market risk premium.
This leads to the capital asset pricing model (CAPM). The CAPM formula is:
Ra = Rrf + Ba (Rm - Rrf)
where,
- Ra = an asset's expected return
- Rrf =riskless rate.
- Ba = beta of stock A
- Rm = Expected market return
Let's practice: A stock has a beta coefficient of 1.35, the expected market return is 9.20%, and the risk-free rate is 2.90%. What is the expected return on this stock?
Answer:
a) CAPM = 0.029 + 1.35(0.092 - 0.029)
CAPM = 0.029 + 0.085 = 0.1141 or 11.41%
The forecasted return on this stock is 11.41%
Another approach is: An evaluation of the Enbridge stock is done, and you are given the following:
-
The risk-free rate is 3.5%
-
The standard deviation of the stock is 13%
-
The standard deviation of the market is 8%
-
The correlation between the stock and the market is 0.65
-
The expected market return is 14%
Calculate the forecasted return for the Enbridge stock.
Answer:
a) 𝛃 = (0.65 x 0.13) / 0.08 = 1.056
b) CAPM = 0.035 + 1.056(0.14 - 0.035)
CAPM = 0.035 + 0.1108 = 0.1459
The forecasted return is 14.59% on the Enbridge stock.
Beta vs. Correlation
Beta measures the effect of one variable impacting another, while correlation measures the frequency of how similar its movements follow each other without considering its effect.
So basically, the Beta is the slope of the two variables while the correlation is the strength of that linear relationship.
So, we know that the correlation of two stocks is beneficial for investors for foresight on what stocks will move with each other; however, it only gives a partial description of its movement.
It measures the tendency of two assets to move in the same direction but does not give the size of those movements.
On the other hand, the beta coefficient contributes information on the direction and relative volatility, which is more efficient when two funds are being compared.
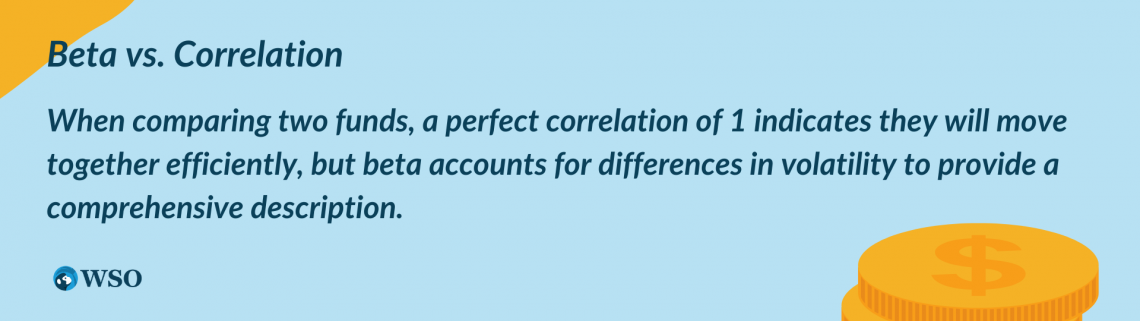
Let's say you're comparing fund A & fund B. After some research, you find that they are perfectly correlated at 1. This shows us that these two stocks will move together in the same direction efficiently; however, it does not account for their volatility.
The beta coefficient takes the differences in volatility (the standard deviation) into account between the return series to provide a full description. Both beta and correlation are essential for investors to incorporate into their investments.
Researched and authored by Michael Rahme | LinkedIn
Free Resources
To continue learning and advancing your career, check out these additional helpful WSO resources:


or Want to Sign up with your social account?