Expected Return
Involves looking at the probabilities of different performances


What Are Expected Returns?
Predicting and timing the stock market is impossible because the number of variables influencing the direction is difficult to quantify. Still, there are methods to get an idea of future performance and its likelihood.
An asset's expected return (ER) involves looking at the probabilities of different performances. It combines all possibilities to get an average to give you an idea of what could happen in the future.
Calculating this return involves multiplying the potential returns by the probability of each outcome. This calculation gives an investor an idea of the positive or negative average returns.
Predicted returns are not guaranteed because the probabilities are based on historical data, which does not indicate future performance.
It is simply a calculation to generate the likelihood that an asset generates a positive return and what that return will likely be.
Although the calculation is simple, it is wise to consider numerous other additional factors when making an investment decision, such as:
- Volatility
- Inflation rate
- Investment capital
- Time horizon
This likelihood is generally used to give an investor an idea of the potential returns compared to the risk.
The ER of an investment can vary over time and is not guaranteed, so it is important to always research assets before investing.
- Expected returns, calculated through probabilities, offer an average estimate of future performance but lack a guarantee due to reliance on historical data.
- Considerations such as volatility, inflation, and time horizon play a pivotal role in investment decisions alongside the expected return calculation.
- Despite providing insight into potential returns and aiding in asset allocation decisions, expected returns should not be the sole basis for investment decisions, as investing inherently carries uncertainty.
- Investors should be mindful that the calculated expected return doesn't fully account for risk, necessitating consideration of factors like standard deviation to assess volatility and align with risk tolerance.
Understanding expected returns
There are advantages and disadvantages of looking at expected returns. This data can help align investments with your investing profile and manage your portfolio, but it has a few drawbacks.
Like any calculation for analyzing a stock, it is essential to have a holistic approach and not focus too much on this number. Investing is risky and would become riskier if you strictly used expected return calculations in your investment decisions.
They are determined by taking into account
- Market trends
- Historical data
- Other risk variables
Investors can evaluate the potential profitability or risk of an investment using expected returns. By contrasting the anticipated returns of various investment possibilities, they aid in decision-making.
It's crucial to remember that projected returns are not promises and that actual investment performance might differ from what was anticipated.
When assessing investment options, investors should also take other aspects into account, such as diversification, risk tolerance, and market circumstances.
expected returns Advantages
Some of the advantages of the Expected Returns are:
- Calculating this return enables you to gauge the estimated return of a portfolio or security based on historical returns. Although it may not be guaranteed, gaining insight into the likelihood of a stock performing to your expectations can be valuable information.
- Estimated returns can aid in determining asset allocation if certain investments have a higher forecasted return.
- Understanding potential returns can assist an investor in aligning their portfolio with their investing profile, specifically their risk tolerance.
- A stock that is more likely to do well is often less risky (albeit every stock is a risk). A risk-averse investor may be more inclined to invest in less volatile assets.
expected returns Disadvantages
Let us take a look at some of the disadvantages:
- The projected future returns are not a guarantee of the actual returns because it is just a calculation, and investing is uncertain.
- While the calculation of potential returns does give you a better idea about the possible performance of the stock, these calculations should not have absolute authority over your investing decisions.
- The calculation doesn't account for risk because it is average. So, for example, two investments could have the same average expected return, but their standard deviations could differ dramatically (look at analyzing risk section below).
- Standard deviation identifies how dispersed the data is about the average, so a stock with a more significant standard deviation is more volatile. Therefore, when investing, you want to consider this factor to ensure the asset aligns with your risk tolerance.
Calculating Expected Return
The general formula to calculate the return is:
R1P1 + R2P2 + … + RnPn
Where:
- R = Return expectation in a given scenario
- P = probability of return occurring in a given scenario (must all add to 1 or 100%)
- n = Scenario number (i.e., number of years)
The distributions can be two types:
1. Discrete distributions show only specific values within a defined range. For example, rolling a die has six discrete possible outcomes (1-6).
2. Continuous distributions can take any value (infinite) within a defined range. For example, a distribution of the heights of adult males can take on any possible values (i.e., 135, 135.1, 135.11, etc.).
These calculations are more commonly used with discrete distributions because continuous distributions have an infinite range of values.
These calculations are more commonly used with discrete distributions because continuous distributions have an infinite range of values.
Calculating Expected Return for a Single Investment
Let's say that a stock has a discrete distribution for potential returns.
- 20% probability of a 15% return
- 50% probability of a 10% return
- 30% probability of a -5% return
These probabilities are based on historical data. For example, the 20% chance of a 15% return could be derived from the fact that over the last ten years, the stock generated a 15% return for two years (2 / 10 = 0.2).
Using the formula stated above, the return of this stock is as follows:
ER of Stock = 0.2 (15%) + 0.5 (10%) + 0.3 (-5%)
ER of Stock = 3% + 5% + (-1.5%) = 6.5%
This means the predicted long-term average return for the stock is 6.5%.
Calculating Expected Return of a Portfolio
Calculating the ER of a portfolio is similar to finding the return for an individual asset. However, now we utilize the weighted average determined by the portfolio's asset allocation.
Let's say that the total value of your portfolio is $10,000 and has three investments:
- $2,000 invested in Stock A with an ER of 15%
- $5,000 invested in Stock B with an ER of 10%
- $3,000 invested in Stock C with an ER of 20%
Using the formula stated above, the expected return of this portfolio is as follows:
ER of Portfolio = 0.2 (15%) + 0.5 (10%) + 0.3 (20%)
= 3% + 5% + 6% = 14%
This means the expected return of the portfolio is 14%.
Analyzing Investment Risk
It is also important to consider risk when determining the expected returns of a portfolio. For example, let's say two portfolios have shown the following returns over the past five years:
- Portfolio A: 12%, 2%, 25%, -9%, 10%
- Portfolio B: 7%, 6%, 9%, 12%, 6%
While both of these portfolios have an expected return of 8%, Portfolio A is more volatile.
The standard deviation of Portfolio A is 11.26%, while for Portfolio B, it is 2.28%. Standard deviation provides insight into the volatility of a stock because it identifies how far the data is from the mean.
A higher standard deviation signifies that the stock is more volatile and comes with more risk. This must be considered to ensure a portfolio aligns with your investment horizon and risk tolerance.
Steps to calculate expected returns in Excel
The steps are:
1. In the first row, enter column labels:
- A1: Investment Name
- B1: Gain A
- C1: Probability of Gain A
- D1: Gain B
- E1: Probability of Gain B
- F1: Expected Rate of Return

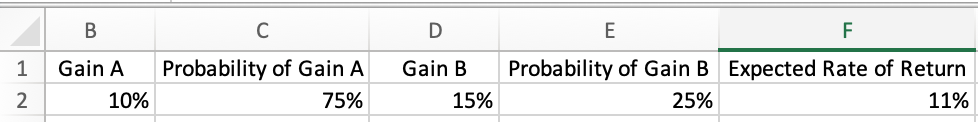
2. Enter the potential gains and their respective probabilities in the second row. Note that the probabilities must sum to 100%.
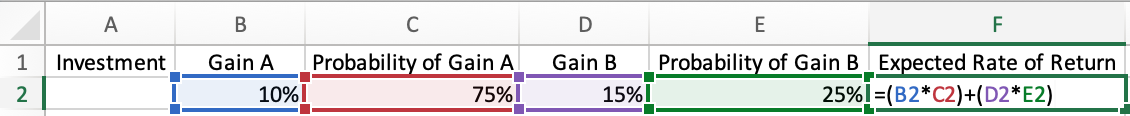
3. In cell F2, enter the formula =(B2*C2)+(D2*E2). Then press enters to get your expected rate of return.
If you are working with more than two potential gains, extend your columns to include Gain C, Probability of Gain C, Gain D, Probability of Gain D, etc.
Expected Return FAQs
Forecasted returns utilize historical returns to determine potential performance in the future. A stock's past performance is the best indicator available to predict what will happen in the future. However, it is essential to remember that the past does not guarantee the future.
Historical returns are realized returns and are known. On the other hand, expected returns are not guaranteed and are likelihoods of potential returns. In other words, the distinction is between past and future returns.
The general formula to calculate the return is:
=R1P1 + R2P2 + … + RnPn
Where:
- R = Return expectation in a given scenario
- P = Probability of return occurring in a given scenario (must all add to 1 or 100%)
- n = Scenario number
As with any investment, you are looking to make money. Any return above 0% means that you made money on your original investment, although it may be drowned out by inflation.
An ideal return on a stock is about 8% to 10% per year. Any return higher is considered an above-average return. Based on the S&P 500, the average stock market return is about 10% per year without accounting for inflation.
With a long-term investing horizon, you should look for a stock to return about 10% per year on average.


or Want to Sign up with your social account?