Historical Returns
It helps in understanding and establishing the asset allocation to minimize risk


What Are Historical Returns?
Historical returns refer to the past performance of an investment or asset, typically expressed as a percentage. It reflects the asset's gains or losses over a specific period that aids in assessing its investment potential.
Looking at the historical return of an asset is often a valuable resource for projecting future performance, but not always. Securities such as bonds, stocks, index funds and ETFs. All have data to represent their past performance. These returns include a security's past rate of return and performance.
Casual investors or financial analysts can utilize the data from previous years. In addition, these returns are often used to project future returns and analyze what variables may affect future returns.
Historical data can demonstrate how a company has responded to external or internal events, such as:
- A change in supply or demand
- Company health
- Global events
- The health of the economy
Past returns are typically recorded for every calendar year (January 1st to December 31st), but fiscal quarter returns are also often commonly recorded. Therefore, an analysis of at least a few years is required to determine a pattern instead of only looking at the annual return of one particular year.
Annual returns also only demonstrate the average rate of return and do not account for fluctuations within the year.
For example, if a company performed significantly well in quarter two but poorly in quarter 3, the annual return would be the final result of all four fiscal quarters' returns.
These returns can be calculated for any financial asset, such as:
- Portfolios
- Indexes (i.e. S&P 500)
- ETFs
- Mutual funds
- Commodities (i.e., gold)
- Stocks
- Bonds
- Real estate
Understanding these returns can assist in establishing your asset allocation to minimize risk. For example, securities that historically have more volatility are riskier investments.
It's important to remember that these returns do not forecast future performance, and investing always comes with some risk.
- Historical return data of securities like bonds, stocks, index funds, and ETFs provide insights into past performance, aiding projections for future returns and analysis of influencing variables.
- Historical data reveals how companies responded to internal and external events such as supply/demand changes, global events, and economic health, assisting in understanding performance patterns.
- Past returns are recorded annually and sometimes quarterly, requiring analysis over multiple years to identify trends and patterns, as annual returns average out fluctuations within a year.
- Calculating past returns involves finding the percentage change between prices, with examples provided for a single year and multiple years, aiding in determining average historical returns.
- Understanding historical returns supports asset allocation to manage risk, but it's essential to supplement with additional research, as historical returns don't guarantee future performance due to changing market conditions and external factors.
Calculation of Historical Returns
Calculating these returns can be a valuable method to determine possible outlooks for a company's future performance.
Below is a simple method to calculate the historical return, but the return can often be observed in stock quotes and stock screeners.
While looking at the returns from a few years in the past can be valuable, it does not guarantee performance in the future. For example, a company could exceed expectations for a couple of years but then experience a downturn in its sector, causing profits to plummet.
Taking these returns calculations with a grain of salt and continuing to do additional research to supplement your estimates is essential.
Calculating past returns is simple when you are given the annual performance data of a security. For example, let's say we are looking at the performance of a stock. If we want to find the historical return of the past year, starting June 1st, we need two values:
- Price of stock on June 1st, 2020: $210
- Price of stock on June 1st, 2021: $250
Step-by-Step on how to Calculate historical returns
Understanding how to calculate historical returns is a vital skill. Not only does it offer a snapshot of past performance, but it also provides a foundation upon which future investment decisions can be based.
Start by doing the following:
- Calculate the difference between the most recent and past price: $250 - $210 = $40
- Divide this value by the past price: $40 / $210 = 0.1905
- Multiply this value by 100 to get the percentage change: 0.1905 x 100 = 19.05%
We can deduce that the stock price increased by 19.05%, which is a good sign the company is performing well. Conversely, the company's stock price would decrease if this percentage came out negative.
Consider that it's the calculation for one year, which is not a reliable indicator of future performance. To observe a pattern, you should look at past returns over multiple years.
For example, let's say you are looking at this same stock. Now, we have the following annual returns for the past five years:
- December 31, 2017: 27.5%
- December 31st, 2018: 12%
- December 31, 2019: -9%
- December 31st, 2020: 19.05%
- December 31st, 2021: 20%
Steps to calculating the average historical return over the 5 years:
- Sum all of the annual returns: 27.5% + 12% + (-9%) + 19.05% + 20% = 69.55%
- Divide the sum by the number of years (or periods): 69.55% / 5 = 13.91%
We infer that the stock price increased, on average, by 13.91% each year over the past five years, meaning it could be a positive sign that the company is doing well because they consistently perform. However, it is essential to look at other factors as well.
Note that simply observing the five-year average rate of return would not show a negative annual return in 2019.
This process can be repeated to find the average returns for any period.
Analyzing historical returns
Past data is often used for fundamental analysis to find trends and forecast a security's direction.
As a result of the rapidly changing global and economic conditions, it is difficult to predict when, if ever, past returns will occur again in the future.
Long-term historical returns often have more to do with the market outlook for that particular industry and the company's financial performance than a technical trading pattern.
Consequently, looking at long-term historical returns can aid investors in investment decisions.
Yahoo Finance is an excellent tool for viewing the returns of a company. For example, here is the chart for Microsoft Corporation over the past five years:
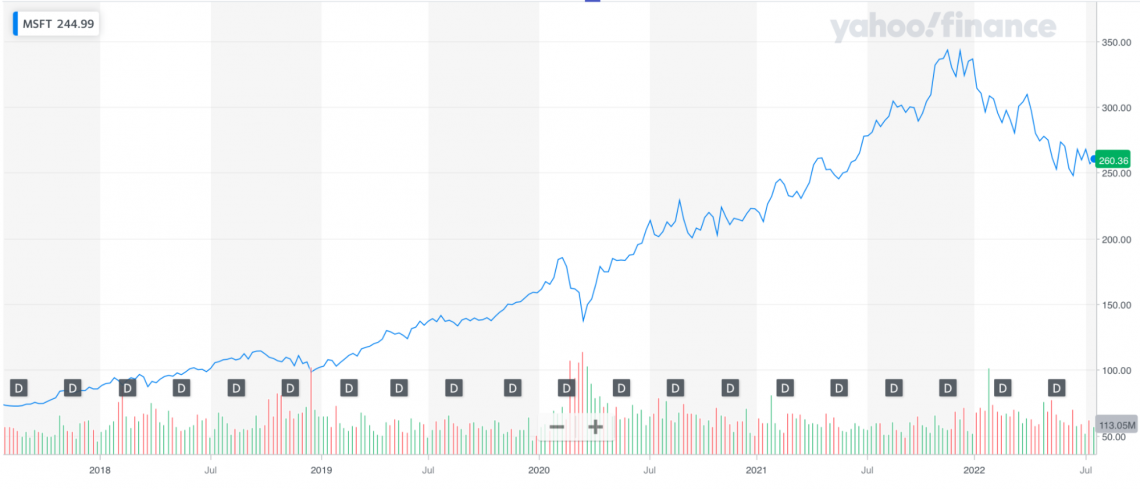
Some charts display the specific returns for various periods such as daily, monthly, or yearly.
In the example above, the graph shows Microsoft's share price from 2018 to 2022.
You can observe the general pattern of an increase in price over the four years. However, some significant dips can also be observed in 2020 and 2022.
These dips in the stock price are likely a result of the COVID-19 pandemic and economic recession, but it is essential to research the cause.
These charts can be valuable for observing stock price trends and comparing patterns with other companies.
Historical Returns FAQs
For the last century, the average historical return of the stock market, without accounting for inflation, has been about 10% per year.
The S&P 500 is considered the benchmark measure for annual returns of the stock market in the United States.
Additionally, the stock market is volatile, so there are fluctuations where the annual return has not been 10%. Between 1926 and 2022, annual returns were between 8% and 12% only seven times.
This rate does not account for inflation, which tends to be about 2% to 3% per year. There is always a risk with investments, but, on average, over a long period of time, you can expect your stocks to have an average return of about 7% to 8%, adjusting for inflation.
Forecasted returns utilize historical returns to determine potential performance in the future. A stock's past performance is the best indicator available to predict what will happen in the future. However, it is essential to remember that the past does not guarantee the future.
Historical returns are realized returns and are known. On the other hand, expected returns are not guaranteed and are likelihoods of potential returns. In other words, the distinction is between past and future returns.


or Want to Sign up with your social account?