Capital Allocation Line (CAL) and Optimal Portfolio
The CAL is a graph showing risk-return tradeoff for portfolios with a mix of a risk-free asset and a risky asset. An Optimal Portfolio is the portfolio allocation that maximizes an investor's expected return


What Is Capital Allocation Line (CAL) And Optimal Portfolio?
The Capital Allocation Line (CAL) and the concept of an Optimal Portfolio are fundamental concepts in finance and investment.
The Capital Allocation Line (CAL) is a graphical representation that illustrates the trade-off between risk and return for a portfolio that consists of a risky asset (or multiple risky assets) and a risk-free asset.
CAL helps investors make decisions regarding the allocation of their investments between these two types of assets.
An Optimal Portfolio is the portfolio allocation that maximizes an investor's expected return while considering their risk tolerance or minimizes risk for a given expected return. It represents the ideal combination of assets that align with an investor's financial goals and risk preferences.
The Capital Allocation Line shows the risk-return trade-off for various portfolio allocations. An optimal portfolio is the mix of assets that maximizes returns for a given risk level or minimizes risk for a specified return target. It's a key concept in portfolio management.
CAL:
- Risk vs. Return: CAL shows that as an investor adjusts their portfolio allocation between risky and risk-free assets, the risk and expected return level also change. It illustrates a direct relationship between risk and return, where taking on more risk has the potential for higher returns and higher volatility.
- Optimal Portfolio: The point at which the CAL is tangent to the efficient frontier (a curve representing portfolios with the highest expected return for a given level of risk) is known as the "Tangency Point" or the "Optimal Portfolio." This portfolio represents the most efficient allocation of assets that balances risk and return, offering the highest expected return for a given level of risk or the lowest risk for a given level of return.
Optimal Portfolio:
- Risk-Return Trade-off: The optimal portfolio balances investors' desire for returns with their willingness to accept risk. It considers the investor's risk aversion, time horizon, and financial objectives.
- Efficient Frontier: The efficient frontier represents a set of portfolios that offer the highest expected return for a given level of risk or the lowest risk for a given expected return. The optimal portfolio typically lies on the efficient frontier, reflecting the best trade-off between risk and return.
- Asset Allocation: Achieving the optimal portfolio often involves diversifying investments across different asset classes, such as stocks, bonds, and cash equivalents, to spread risk and enhance returns.
In this graph below, it is possible to see the return investors could have when estimating a specific level of risk linked with their investment.
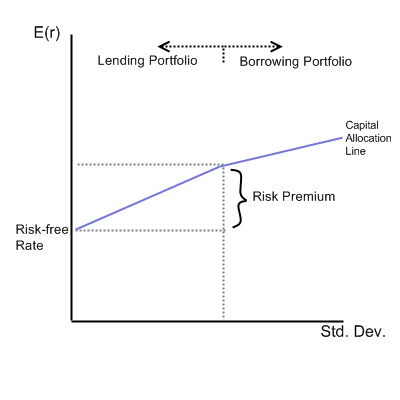
The slope of such a line is the reward-to-variability ratio, a metric that computes the return generated by a portfolio for each unit of risk taken. The capital allocation line displays portfolios that perfectly merge risk and return.
This theoretical framework shows all portfolios that merge the risk-free rate of return and riskier assets. Investors choose an equilibrium spot on the CAL with the capital asset pricing model (CAPM).
The capital market line is used to find optimal portfolios, analyzing assets based on a risk-reward structure. It helps investors choose the amount of capital to invest in risk-free and riskier assets.
- CAL illustrates the risk-return trade-off, while the Optimal Portfolio balances risk and return.
- Adjusting asset allocation affects risk and expected return.
- CAL's slope, the Sharpe Ratio, measures risk-adjusted returns.
- Portfolios on it offer the best return for a given risk level.
- Modern Portfolio Theory (MPT) promotes diversification with low-correlation assets, often seen in ETFs, to reduce risk.
CAL Formula
The CAL is created for investors to assess the exposure of risky and risk-free assets. The following equation gives the capital allocation line:
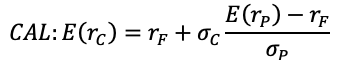
In this equation, the expected return of the portfolio (C) - a mix of risk-free assets (F) and risky investments (P) - is equal to the rate of return on risk-free assets added to the product of portfolio C's standard deviation and the risk premium.
The risk premium is an indicator that balances the risk. It is given by the subtraction of expected return on risky assets and rate of return on risk-free assets, all divided by the standard deviation of a portfolio of risky assets.
An approach investors might take to manipulate a portfolio's risk level is to modify the amount allocated to risk-free assets. This equation accounts for every mix available of risk-free and risky assets.
They are located on a chart in which the x-axis is the risk of the asset, given by its standard deviation, and the y-axis is the expected return.
On such a graph, the slope is equal to the marginal return of the portfolio to the marginal risk. As you can see, the expected return grows proportionally with the standard deviation.
Sharpe Ratio
The slope of the capital allocation line is also called the Sharpe Ratio or reward-to-variability ratio. This is because it computes the relationship between risk and returns. The higher the slope, the higher the expected return and risk.
William F. Sharpe promoted the Sharpe ratio. Its purpose is to aid investors in balancing an asset's rate of return compared to the risk.
It is the difference between the returns of the investment and the risk-free rate, divided by the standard deviation of the investment returns. It represents the additional return an investor receives per unit of increase in risk.
Such an indicator can adequately explain if some portfolios' excessive returns result from high levels of risk or just good returns on investment.
Even if specific portfolios have higher returns than others, they might also have a higher risk. Otherwise, it is considered a good investment if the level of risk is the same as others but with a higher rate of return. If the Sharpe ratio is above 1, the portfolio generates excessive returns compared to its volatility.
A greater Sharpe ratio means a portfolio's risk-adjusted performance is better. If the Sharpe ratio is negative, it could mean:
- The risk-free rate is higher than the return of the portfolio
- The portfolio's return is likely to be negative
How to use the capital allocation line and Build an Optimal Portfolio
Let's consider a portfolio with two assets and the following percentages of risk and return:
- Treasury bill, with an expected return of 1.8% and a 0% standard deviation;
- A stock with a 15% expected return and standard deviation equal to 22%.
At this point, an investor has to decide the amount to invest in these assets. Then, the expected return of the portfolio will be computed as:
![]()
The portfolio's risk will be given just by multiplying the weight of the stock and its standard deviation because the standard deviation of the treasury bill is 0%.

Following this line, if the investor decides to allocate all of his money into the stock, the expected return is 15%, and the portfolio risk is 22%; on the other hand, by allocating all of the investment into the risk-free treasury bill, the expected return is 1.8% and the portfolio risk 0%.
If we assume that the investor wants to allocate 90% of his money into the stock and the remaining portion into the treasury bill, the expected return and risk of the portfolio would be:
![]()
![]()
As we have seen in this example, investors can actively influence performance and risk by adjusting the weight of their investments.
This approach enables investors to allocate their funds among a diverse set of assets properly. Based on how willing they are to expose their portfolios to risky investments, they can manipulate the asset allocation according to their preferences.
The Efficient Frontier and the Optimal Portfolio
The efficient frontier is the combination of optimal portfolios that offer the highest rate of return at a determined risk rate.
An optimal or efficient portfolio is a portfolio that includes both risk-free and risky assets located at the tangent of the efficient frontier and the capital allocation line.
Portfolios below the efficient frontier are called "sub-optimal" as they do not have the rate of return required for that particular level of risk.
Sub-optimal portfolios are found on the right of the efficient frontier, and their level of risk is too high for the rate of return.
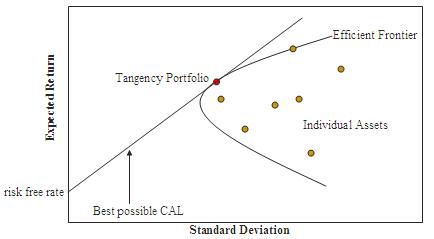
As we can see, the optimal portfolio is at the tangent point of the efficient frontier and the capital market line. This is because, at that point, the slope is the highest. By ensuring their portfolio is a tangent, an investor can achieve the best rate of return based on the given level of risk.
An optimal portfolio contains several assets that investors are comfortable investing in.
It is highly subjective to determine whether a portfolio can be defined as efficient, as investors have different preferences and portfolio strategies and do not always have the same feelings regarding a high level of risk.
For example, investors who like high volatility and are willing to risk their money will likely allocate most of their funds to risky assets, such as stocks or commodities.
For this case, an efficient portfolio will be composed of assets with high volatility while offering the highest return available for the level of volatility chosen by investors. While such opportunities offer a great return rate, the risk level is considerable, and investors might lose money.
On the other hand, investors who are less willing to risk their money and have more secure portfolios will choose another approach.
In this case, the efficient portfolio will have lower volatility rates, composed of risk-free assets such as treasury bills. These portfolios have a low standard deviation, meaning investors are less exposed to risk. However, it also means that the expected rate of return will be lower.
Generally, investors agree that optimal portfolios will be composed of different kinds of investments that balance the portfolio such that losses will not occur often. Several portfolio strategies can best fit an investor's financial goals.
Modern portfolio theory (MPT) and Harry Markowitz
Harry Markowitz created the efficient frontier theory as a part of the Modern Portfolio Theory (MPT). It supposes that investors want to avoid risk, meaning that they will choose a less risky portfolio for a certain return.
This investment theory helps investors build a portfolio with the highest expected return, given the chosen level of risk. As a result, the theory implies that investors will achieve higher rates of return if they increase risk.
Variance and correlation are two statistical measures crucial in modern portfolio theory; they strongly influence the process that makes investors choose the best asset.
For example, it is suggested that investors should pick equities with low correlation among themselves, effectively diversifying their portfolios.
The MPT states that each investment's risk and rate of return and how it impacts a portfolio's metrics must be considered. The theory is an excellent instrument for investors who want diversified portfolios.
They need to build portfolios of various assets, and by doing so, they will hopefully achieve the desired return rates with the lowest risk.
Diversification In The MPT
The modern portfolio theory opened the door to the diversification concept in finance. It is stated that investors should choose assets that are less correlated among themselves.
By doing so, the portfolio will be less exposed to a particular set of similar equities, industries, regions, etc. The portfolio diversification strategy's goal is to buy equities that are not perfectly correlated, lowering risk as much as possible.
Correlation is a coefficient that goes from -1 to 1, and it indicates the connection of two assets' price movements. If its value is 1, the assets move precisely in the same direction every time. Generally, investors that follow this strategy want to avoid owning perfectly correlated assets.
On the other hand, if the correlation is -1, then it means that the assets move in the opposite direction of each other but with equal magnitudes. This should also be avoided.
Lastly, if the correlation is equal to 0, it means that there is no correlation at all among the assets. Again, this is best for diversification.
There are many ways in which portfolios can be diversified. It is crucial to own assets that are not correlated. A well-diversified portfolio owns assets that belong to different markets or industries.
The increased popularity of ETFs (exchange-traded funds) made the MPT a fundamental theory in the eyes of investors. As a matter of fact, with such financial products, investors can decrease their portfolio risk due to the significant diversification provided.


or Want to Sign up with your social account?