Time Series Data Analysis
Study and learn the changes in data of a specific variable over a specified period.


What is time series data analysis?
Time series data is the accumulation of records of a single variable and its observation over a certain period. Time series analysis uses machine learning to help us study and learn the changes in data of a specific variable over a specified period within our world.
It observes the data point of the same variable over several different points in time. So, for example, if we look at Apple’s stock price data over the past five years, the variable is Apple’s stock price, and the time will be the past five years’ spectrum.
This could be a univariate or multivariate time series. Univariate means an analysis implicating only a single variable, for example, a company’s stock price changes. Multivariate means an analysis implicating two or more variables.
Univariate is the most often used time series as it is the simplest form using only a single variable. Multivariate is typically used when comparing and contrasting performances, for example, a competition of stock prices between two conglomerates.
The data recording could be done in forms from minimum by seconds to monthly or even annual basis. This has to be consistent throughout the period they are recording data.
For example, the stock price is recorded by its adjusted beginning and closing prices from the opening time to the closing time of the stock market. The price changes are accessible on a minute-by-minute basis.
Analysts could use the time series data in any form to fulfill their objectives. For example, financial analysts could use stock price movement or the company’s quarterly sales data to analyze company performance.
The analysis method comes in multiple forms entitling knowledge in mathematics and computer science. The result of the analysis can then become the supporting evidence behind a claim or judgment toward a certain phenomenon.
- Time series data analysis correlates the data of a single variable with a certain period in consistent intervals.
- Stock price and quarterly sales data are examples of financial time series data.
- Analysts can use such analysis to understand historical patterns and trends and project them to futuristic forecasts using mathematics and technology.
- ARIMA, CV, and exponential smoothing are well-known methods to project or forecast based on time series data analysis.
Understanding time series Data
Time series data is different from other data because it can show how variables change over time. In other words, time plays an important role as an index when observing a single variable and recording the changes of itself over a certain period.
Time is an exclusive source of information and sets an index or orderly manner of a certain variable’s data. In most cases, the analysis process requires numerous observations or data points in chronological order to establish the reliability of the analysis procedure.
Like other data analysis procedures, time series data should ensure a representative sample size and appropriate procedural steps to reduce noise and inaccuracy. Also, trends and patterns discovered can be foreseen from the analysis itself.
Time series data can be used in various forms of analysis, such as trend and pattern recognition, forecasting, and much more. Four main components explain the aspect of data movement within a time series data:
- Secular Trend - A variable with a consistent pattern within a certain period. E.g., Maturation of companies, growth stocks, and aging population.
- Seasonal Variations - Occurrences in time that are repeated more or less regularly within a one-year time frame. E.g., Hurricane or Monsoon occurrence, higher ice cream sales in summer.
- Cyclical Fluctuations - Occurrences that have regularity in their recurrences, usually lasting for two or more years. E.g., Business Cycle
- Irregular Variations - Unpredictable occurrences that do not follow a certain trend or repetition within a definite pattern; all variations that are not part of the above three listed (e.g., secular trend nor cyclical or seasonal variations) belong to irregular variations. E.g., Occurrences of droughts, famines, earthquakes, and financial crises.
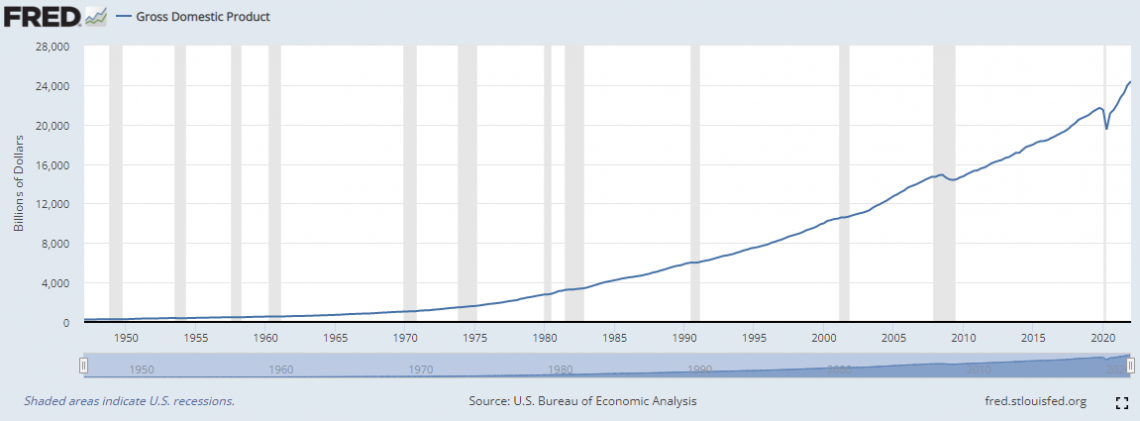
Time series data analysis is used in both financial and non-financial contexts. For example, measuring seasonal weather trends, unemployment rates, or currencies. The figure below depicts the U.S. GDP from 1950 to 2020.
Time series data analysis examples
Non-stationary data are typically used in time series analysis. Non-stationary data are data points that contain variance and covariance, possibly changing over time. Static data, on the other hand, does not change over time.
Non-stationary data may have trends, seasonality, cycles, irregularity, or a combination of all four components. The four components include the following:
- Secular Trend
- Seasonal Variation
- Cyclical Variation
- Irregular Variation
More about these components are explained below under “Understanding Time Series.”
The range of uses involves financial fields such as equities, real estate, and currencies to non-financial fields such as meteorology, astronomy, and biology, to name a few.
Examples in Financial fields include:
- Quarterly Retail Sales
- Stock prices over time
- Real Estate Prices over time
- GDP and GDP per capita
- Interest rates
- Unemployment Rate
- Forex Trading
- Bitcoin Trading
Examples of Non-Financial fields include:
- Weather Forecasting
- Precipitation or Rain Measure
- Brain Monitoring (EEG)
- Temperature Reading
- Heart Rate Monitoring (EKG)
- YouTube Subscribers
Why do organizations use time series data analysis?
Time runs in one direction, in an ongoing and continuous sequence, from the past through the present to the future. Along this sequence, humans observe and face many personal, economic, or political events.
Anything that has occurred in the past is now called history, and anything we haven’t yet faced is left as the potential for the future. Throughout a tremendous period, humans began to record what they have an interest in and observed through years, decades, and even centuries!
Recorded data helps us learn history, improve from previous occurrences, and help project the future. Using historical data can help us analyze the bigger picture of patterns and attempt to forecast the occurrences in the future by learning the patterns and trends.
The assumption is that the world may be moving in a mysterious pattern and trend. Time series analysis allows us to understand the data and its changes over time and helps us derive important aspects of the data for today and tomorrow.
Organizations use time series analysis to understand the causes of trends or systematic patterns of a certain variable, such as organizational discrepancy or product performance in current market trends.
Visualizing the dataset makes it easier for business users to grasp the patterns and trends by visually viewing them in graphs, which can help them analyze why such trends occur.
Organizations may analyze the data over a consistent time interval and use it to predict the probability of future events using time series forecasting based on historical data. This is part of businesses’ predictive and preventative analysis practice.
Organizations can also retrieve analytical perspectives from historical data for current status recognition, diagnose the problem, and present newer ideas to improve business practices. As a result, data analytical practices have become essential to keep businesses’ core functions running.
The advancement in today’s technology helped us to collect massive amounts of comprehensive data and interactions. Data analysis has become simpler than ever, thanks to the digitalization of data recording processes and the development of newer technologies applicable to data analysis.
What Is Time series analysis?
Let’s say you want to analyze Apple’s daily closing stock prices over one year. To obtain the data, you can use any stock data platform to retrieve the daily closing prices of Apple for the past year.
This dataset will become a time series of Apple’s daily closing price for one year. Using this dataset, you can perform various forms of analysis using technical and mathematical tools.
Let’s try visualizing this dataset in a line graph. A line graph is one of the most representative visualizations of time series data, especially when only using a single variable. For example, shown below is Apple’s stock data for the past year.
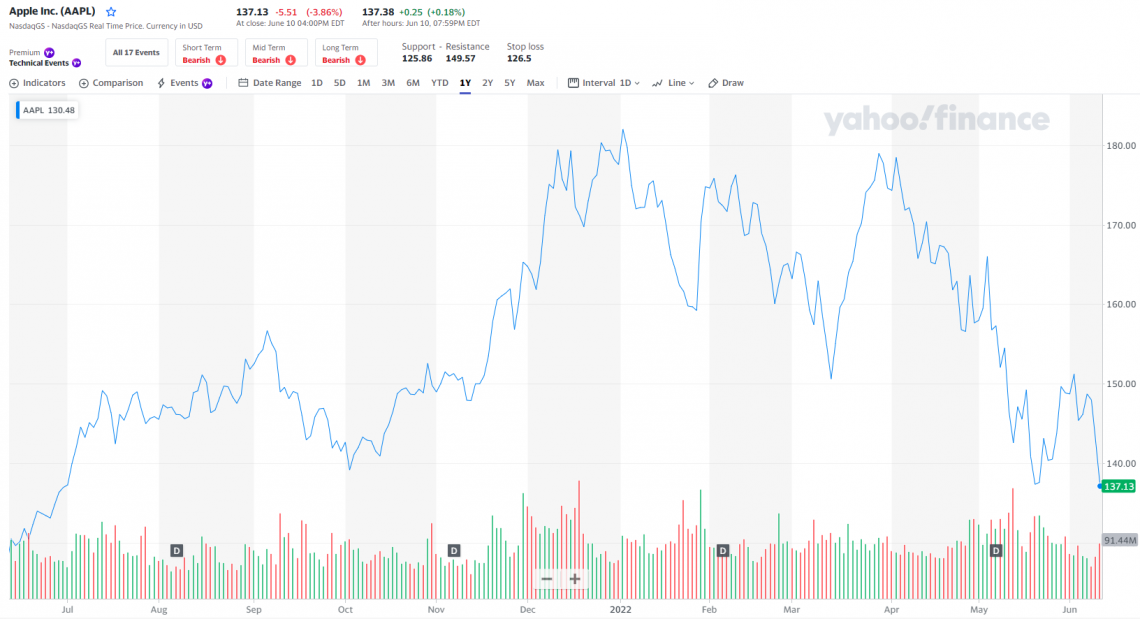
You can now look for local minima and maxima, indicating the trough and crest in the stock price changes over the year. This is one of the most important features of finding patterns in stock price fluctuation by the time of year.
The stock price patterns can be seen by correlating them to certain months or several months of the year. For example, seasons can include summer and winter or holiday seasons.
Let’s say the minima and maxima replicate every 3-4 months. This is considered a seasonal trend, where users can view some sort of repetitive variation within one year. Cyclical will be a bigger span of this.
Since stock prices fluctuate purely from the investors’ demand and supply, an indication of price changes may not reflect only the company’s performance.
There are times when stocks are overbought and/or oversold depending on the investor activities and more reliably on the economic or political situation.
Suppose you want to analyze the stock prices toward economic variables such as the unemployment rate or irregular variation such as war. In that case, you can do so by correlating the data with one other variable.
This creates a dependency on stock price changes by occurrences of events and, more typically, understanding the bigger picture of how economic movements correlate with investor activities deriving from a stock price change.
What Is Time Series Forecasting?
Time series forecasting utilizes historical data and predicts the likelihood of recurrence in the future. However, it relates to trend or cyclical analysis of time series data and is not a 100% guarantee of event recurrence.
Forecasting methods require a substantial understanding of patterns, technical tools, and a mathematical understanding of pattern recurrence. There is a substantial amount of time spent double-checking the adequacy of the data to forecast time series data.
First, the user may need to figure out the data’s non-stationarity, the existence of auto-correlation, and the significance of data points using the Ljung Box Test, T-statistics, fat tail test, and more. The user might also encounter using differentiation or autoregression modeling depending on data.
ARIMA (aka Auto-Regressive Integrated Moving Average) is a machine learning technique often used to forecast stock price movement and futuristic growth.
Using ARIMA(p, d, q) to indicate the autoregression, integration (or differentiation), and moving average, the user may interrelate historical data to represent futuristic movement. Other techniques, including CV (Cross Validation) and exponential smoothing, can be applied for similar forecasting analysis.
What are programming languages used In Time Series Data Analysis?
Today, many users take the computer science approach toward data analysis. This makes the task simpler and more automated, where humans do not have to input so much mathematical calculation or graph by hand as before.
Well-known programming languages that many users use to conduct time series data analysis should include packages, libraries, and visualization that could help the entire process, from data cleaning and preparation to conducting the actual analysis.
Some well-used programming languages are listed as follows:
- R
- Python
- Java
- C/C++
- MATLAB
- Tableau (only for visualization purposes)
- PowerBI (only for visualization purposes)
Each program has built-in or ready-to-be-installed packages and libraries that allow the implementation of machine learning to retrieve data. In addition, each programming language has a specified function and differences in supporting functions that make each a little different.
For example, R is well known for statistical applications, which suit well with time series data analysis. Python and Java also do similar functions except for the orientation of programming languages that differ from statistical applications.
However, many financial data analysts opt for Python as one of the most popular programming languages in today’s financial fields, including the big 4 and banks.


Research and authored by Da Hye (Tae) Kwon | LinkedIn
Free Resources
To continue learning and advancing your career, check out these additional helpful WSO resources:


or Want to Sign up with your social account?