Aroon Indicator – Technical Analysis
Identifies whether a stock is trending or not, as well as how strong the trend is.


What Is the Aroon Indicator?
Aroon is a technical indicator developed by Tushar Chande in 1995 that identifies whether a stock is trending and how strong the trend is.
Identifying a trend and its strength assists investors and traders in detecting purchasing or selling opportunities for assets, reduces risk, and facilitates better decision-making, improving portfolio performance.
In Sanskrit, the word "Aroon" denotes the first light of dawn. Because the indicators are intended to signal the start of a new trend, Chande picked this name for the hand.
The Aroon indicator is used to identify and measure the strength and direction of a trend in a financial instrument's price movement.
The indicator consists of two lines, the Aroon Up and the Aroon Down, plotted on a chart to help identify trends and potential reversals.
Aroon's default setting is 25 days. Aroon up counts the days since the most recent 25-day high, whereas Aroon down counts the days since the most recent 25-day low.
The Aroon Indicator is an indicator with a range-bound output that generates values between 0 and 100. The Aroon up and Aroon down values are calculated using the following formulae:
Aroon up = 100 * [(25 - Periods since 25-period high)/25]
Aroon down = 100 * [(25 - Periods since 25-period low)/25]
A strong uptrend is seen when Aroon-Up is over 50, close to 100, and Aroon-Down is below 50. Similarly, a deepening downtrend may be imminent when Aroon-Down is over 50, close to 100, and Aroon-Up is below 50.
-
The Aroon indicator is used to recognize trends in price movements of financial instruments and to gauge their intensity and direction.
-
It is a range-bound indicator that produces readings between 0 and 100. The technical analyst should focus on three areas on that scale:
-
The Aroon Up and Aroon Down lines, which make up the indicator, are placed on a chart to assist in spotting trends and possible reversals.
-
A new upswing may begin shortly if the Aroon-up crosses above the Aroon-down. When Aroon-up is over 50 and close to 100, and Aroon-down is below 50, a new uptrend is underway.
Using the Aroon Indicators
As was already mentioned, the Aroon indicator is used to recognize and assess the magnitude and trajectory of a trend in the price movement of a financial instrument. It can be used in the following ways:
1. Identification of a fresh uptrend
A new upswing may begin shortly if the Aroon-up crosses above the Aroon-down. When Aroon-up is over 50 and close to 100, and Aroon-down is below 50, a new uptrend is underway.
One can see this in the example given below:
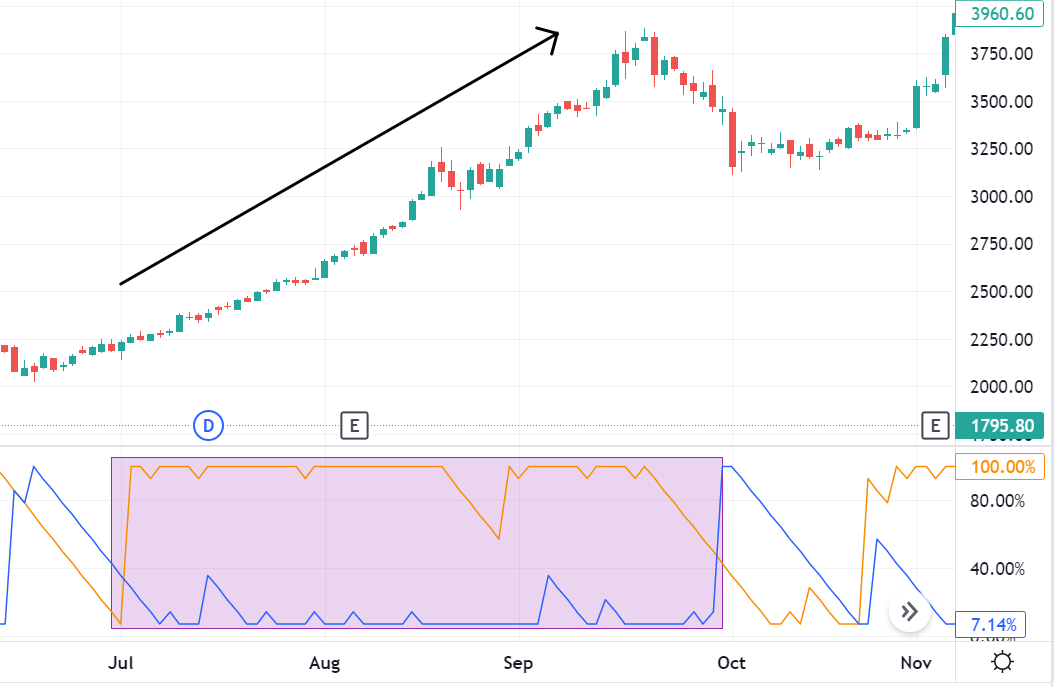
The upper part of the image is the price chart of the stock, whereas the lower portion of the picture is a representation of the Aroon indicator. Here, the blue line represents the Aroon-down line, whereas the orange line represents the Aroon-up line.
Notice that the shaded rectangular box above is part of the indicator where the Aroon-up line crosses above the Aroon-down. One can expect an uptrend in the stock and look for buying opportunities.
After this intersection, Aroon-up is over 50 and close to 100, and Aroon-down is below 50 and at times near 0. It confirms the start of a fresh uptrend (as represented by the black arrow on the chart).
2. Identification of a fresh downtrend
A fresh downswing may begin shortly if the Aroon-down crosses above the Aroon-up. A downtrend is underway when Aroon-up is below 50, close to 0, and Aroon-down is above 50 and near 100.
One can see this in the example given below:
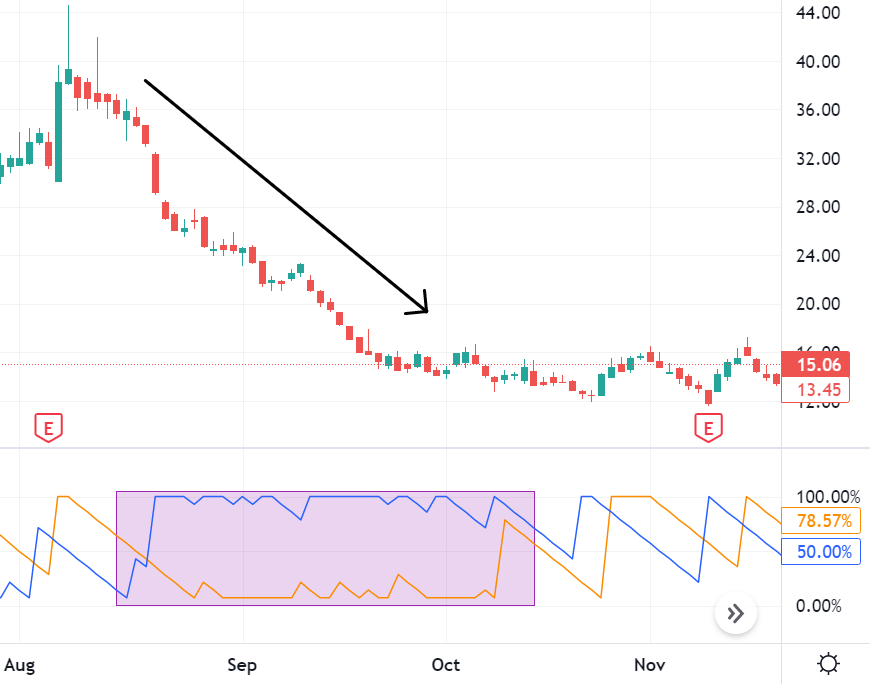
You can see that when the Aroon-down line crosses above the Aroon-up line, it marks the start of a fresh downtrend, and the traders can look for selling or shorting opportunities in the stock.
After the intersection of the two lines, you can notice that the Aroon-up is below 50 and close to 0, while Aroon-down is above 50 and near 100. It confirms the start of the downtrend (represented by the black arrow).
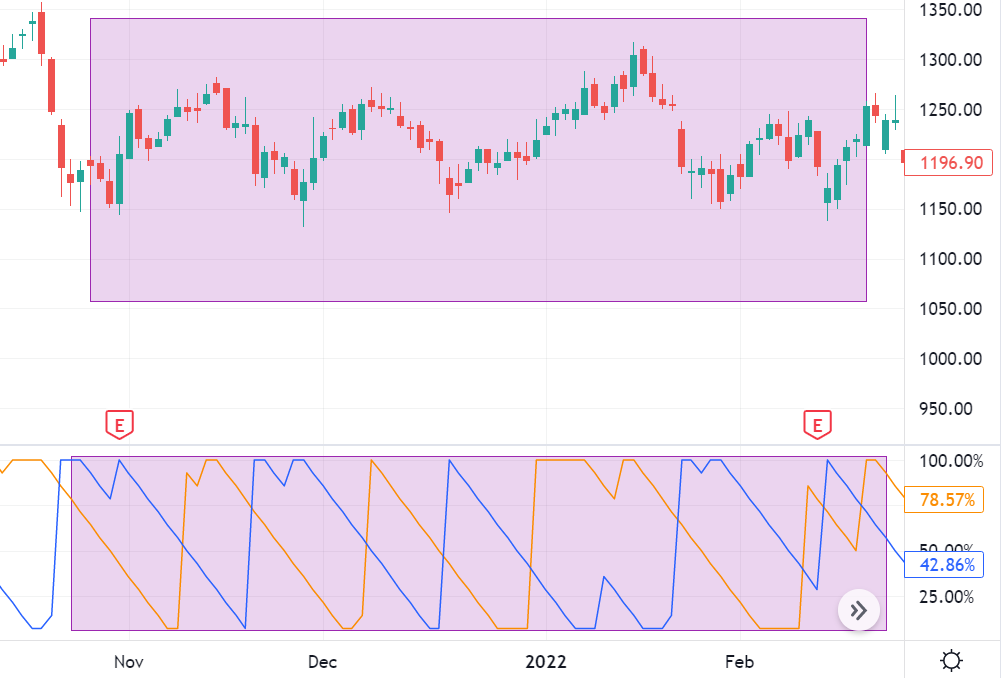
3. Identification of consolidation phases
During phases of consolidation, Aroon-up and Aroon-down move parallel to each other.
The upper highlighted region in the image below shows the stock price movement. It is visible that the stock is in a mood to consolidate and is range-bound.
The lower highlighted region will show how the Aroon-up and Aroon-down lines move parallelly during this consolidation phase. Therefore, it is difficult to predict which direction the asset will proceed using the Aroon indicator.
Picking the right trade using Aroon Indicator Technical Analysis
Here is an example wherein we will apply what we have learned above. Let us use the Aroon indicator to pick up a profitable trade.
Below is the price chart of the Adani Enterprises stock, listed on the Bombay Stock Exchange (BSE), India. The point of intersection, where a red circle has marked the Aroon-up crossing above the Aroon-down. At this point, one can expect the underlying price to go up.
As in the charts above, the blue line represents the Aroon-down line, whereas the Aroon-up line is orange.
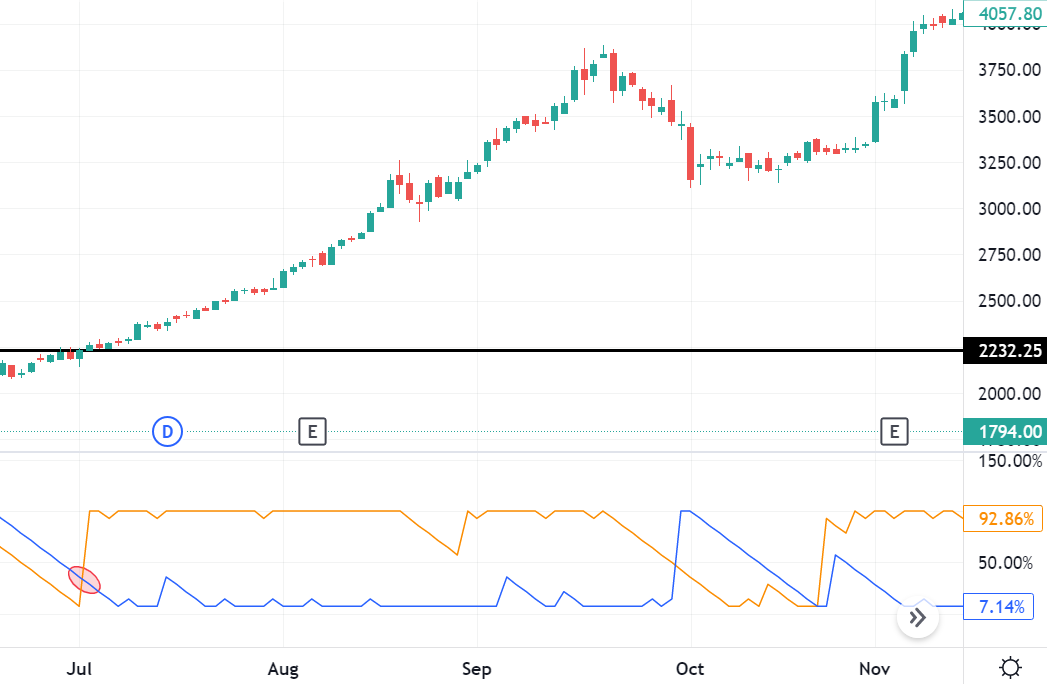
When the Aroon-up line crosses above the Aroon-down, the underlying trades at INR 2232.25.
A trader can look to buy the stock at this price point since this intersection suggests a possible upmove. The idea is to hold onto the store as long as the Aroon-up stays above the Aroon-down.

As expected, the price of the underlying goes up after this crossover. Also, the Aroon-up line stays above 50 and near 100, whereas the Aroon-down stays below 50 and near 0. It again confirms that the uptrend is a strong one.
Later we see that the Aroon-down crosses above the Aroon-up (the green colored circle on the chart represents this intersection). At this point, the price of the stock is INR 3466.70.
The trader should choose to square off the trade at this point. The trade results in substantial profits, equivalent to INR 1234.45 (3466.70 - 2232.25), which roughly translates to a 55% profit per share.
Note
Why did we not sell the stock earlier when the store price was even higher? However, one must realize that timing the market to sell at a high is extremely difficult, and one can only estimate how the market will move.
Aroon Indicator Advantages
The Aroon indicator can be a valuable tool for traders and investors looking to identify market trends and make informed decisions about their trading strategies.
Below mentioned are a few advantages of using it.
1. Helps to identify trends
The indicator is designed to identify when a new trend is beginning or an existing trend is weakening. It can help traders and investors recognize the direction of the movement and make informed decisions about when to enter or exit a trade.
2. Simple to use
It is relatively simple to use and can be easily understood by traders and investors of all experience levels. It is a straightforward indicator that provides clear signals about the strength and direction of the trend.
Note
A fresh downswing may begin shortly if the Aroon-down crosses above the Aroon-up. A downtrend is underway when Aroon-up is below 50 and close to 0, and Aroon-down is above 50 and near 100.
3. Provides early signals
One of the key advantages of the indicator is that it provides early signs of potential trend changes. It can be precious for traders and investors looking to enter or exit a position before the trend fully develops.
4. It can be used in conjunction with other indicators.
The Aroon indicator can be combined with other technical indicators, such as moving averages or the relative strength index (RSI), to provide a more comprehensive market picture.
5. Works well in trending markets
The Aroon indicator is particularly effective in trending markets, where it can help traders and investors identify and capitalize on the direction of the trend.
Aroon Indicator Disadvantages
While the Aroon indicator may be a valuable tool for spotting trends and making knowledgeable trading decisions, it also has several limitations that investors and traders should know.
Some of these limitations include:
1. Lagging indicator
The Aroon indicator, like the majority of technical indicators, is a lagging indicator, which means that it relies on historical price data and cannot offer real-time market data.
2. May generate false signals
The Aroon indicator can generate false signals, particularly in choppy or sideways markets with no clear trend. Traders and investors should carefully confirm signals the hand generates with other technical or fundamental analysis tools.
Aroon Indicator is most effective in trending markets where it can accurately identify and capitalize on the direction of the trend.
3. Not suitable for all markets
The Aroon indicator may not be ideal for all needs, particularly those highly volatile or with low liquidity. In these markets, the hand may produce unreliable signals and may not be a valuable tool for traders and investors.
4. Limited scope
The indicator is designed to identify trends and is less effective in identifying other necessary market conditions, such as support and resistance levels or market volatility.
5. Can be overly sensitive
It can be susceptible to minor price movements, which can generate a large number of false signals and may lead to poor trading decisions.
Conclusion
The Aroon indicator serves as a valuable tool for traders and investors seeking to navigate market trends and make informed decisions. Its simplicity and ability to provide early signals make it accessible to traders of all experience levels.
When used in conjunction with other technical indicators and analysis methods, the Aroon indicator can offer a comprehensive view of market dynamics, aiding in the identification of potential buying or selling opportunities.
While useful, the Aroon Indicator, like any technical tool, has limitations and can produce false signals, especially in choppy or sideways markets, requiring careful validation with other analysis methods.
Despite its limitations, the Aroon indicator remains a valuable asset in a trader's toolkit, particularly in trending markets where it can help identify and capitalize on price movements.
However, it's essential to acknowledge the limitations of the Aroon indicator. Being a lagging indicator, it relies on historical data and may generate false signals, particularly in choppy or sideways markets.
By understanding its strengths and weaknesses, traders can utilize the Aroon indicator effectively to enhance their trading strategies and improve overall performance in the financial markets.

Free Resources
To continue learning and advancing your career, check out these additional helpful WSO resources:


or Want to Sign up with your social account?