Directional Movement Index (DMI)
The index helps to identify directional trends and measure the trend's strength


What is the Directional Movement Index (DMI)?
The Directional Movement Index, frequently abbreviated to DMI, is a technical indicator invented in 1978 by an American mechanical engineer and technical analyst, J.Welles Wilder to help identify directional trends and measure the trend's strength.

Regarding trend trading, Directional Movement Index (DMI) and the Average Directional Index (ADX) are the ultimate indicators to be conscious of. They are both like the wind flags, showing where the wind goes (trend directions) and how strong it is (trend strength)
DMI assists traders in navigating in the right direction and "go with the flow." In the following article, we will examine the strength of DMI and ADX as trend indicators.
- Directional Movement Index (DMI) helps identify trends, while Average Directional Index (ADX) gauges trend strength, aiding traders in making informed decisions.
- DMI consists of Plus Directional Indicator (+DM), Minus Directional Indicator (-DM), and ADX. These indicators reveal trend direction and market strength.
- Directional Movement Index (DMI) and Average Directional Index (ADX) help traders identify trend direction (+DI and -DI) and measure the trend's strength (ADX).
- DMI's calculation involves determining trend direction, calculating the Average True Range (ATR), and combining these values. Traders use DMI to identify buy/sell signals based on +DM and -DM crosses and ADX levels. In consolidating markets, they indicate no clear trend.
- DMI and ADX have lag and can't predict the future. Combining these indicators with others and focusing on trends increases trading effectiveness.
Understanding the Directional Movement Index (DMI)
Directional Movement Index is a combination of 3 independent indicators:
- Plus Directional Indicator (+DM)
- Minus Directional Indicator (-DM)
- Average Directional Index (ADX)
DMs represent the possibility of price direction based on the last 14 bars of data, while ADX confirms if a trend forms, not considering the price direction.
By combining the three indicators, technical traders better understand the market direction and the trend strength.
Compared to Moving Average Convergence Divergence (MACD), a mid-term technical indicator, Directional Movement Index (DMI) is considered a mid-long-term indicator.
Calculation of the Directional Movement Index (DMI)
The calculation of DMI is quite complicated; it requires determining the stock price trend and the actual volatility before calculating the indicator.
A. Preliminary work
1. First, determine whether the stock price trend (Directional movement, DM) is an uptrend or a downtrend.
DM value is the value difference between today's stock price maximum volatility - yesterday's stock price maximum volatility:
DM value = (today's highest / lowest price - opening price) - (yesterday's highest / lowest price - opening price)
- If the highest price of stock continues to rise, it is an upward trend known as +DM
- If the lowest price of supply continues to fall, it is a downward trend known as -DM (the negative sign of -DM means a downward trend rather than a negative sign)
- Other conditions: DM = 0
2. Find out the Average True range (Atr) in stock price:
Valid range is calculated by determining the maximum difference, i.e., the volatility, between today's highest price, lowest price, and yesterday's closing price.
3. A trend direction requires a certain period to be confirmed as a credible observation. In general, 14 days is regarded as a plausible confirmation period to be used for generating an indicator:
Therefore, first, calculate the 14-day arithmetic mean of +DM, -DM, and Tr, and obtain three sets of data of +DM14, -DM14, and Tr14, then calculate the respective Exponential moving average (Ema).
B. Indicator Calculator
Given the above-calculated value, the calculation of the index is shown as follows:
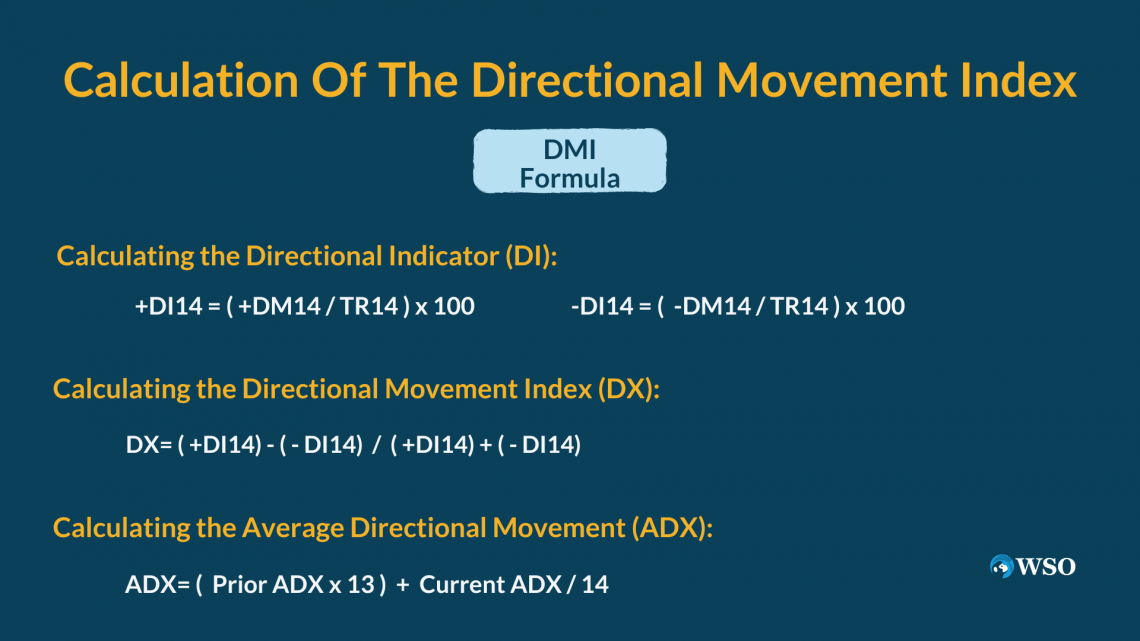
1. Calculating the Directional indicator (Di):


The actual volatility (TR) is the highest volatility of the stock price fluctuation within 14 days, and the directional movement indicator is within this range. Therefore, the direction indicator (DI) value will be between 0 and 100.
For example, +DI14 = 54, –DI = 32, which means that in the past 14 days, the upward trend accounts for 54%, the downward trend accounts for 32%, and the remaining percentage has no direction.
2. Calculating the Directional Movement Index (DX) and Average Directional Movement (ADX):

Taking the absolute value of DX from the calculation makes it possible to determine the moving average of DX to have an Average Directional Index.
Trading Using the DMI And ADX
The directional movement indicator shows the trend direction. +DI and -DI represent the opposite directions, and the average directional movement index shows the trend strength.
As mentioned before, Directional Movement Index is usually used together with the Average Directional Index, with different implications of the market moving trend.
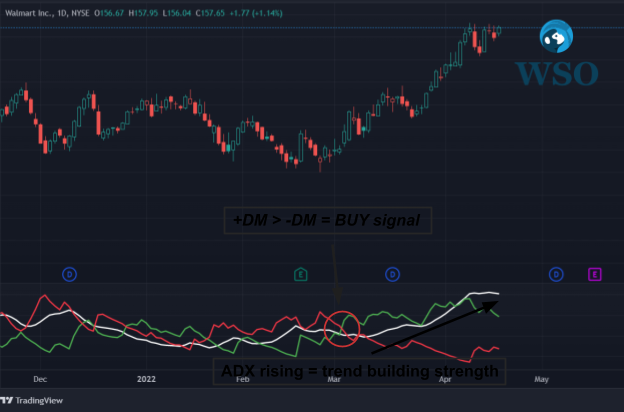
1. BUY / SELL Signal
- +DM and -DM Crosses: When +DI crosses -DI from under, it means the uptrend strength is stronger than the downtrend strength, indicating a Buy Signal.
- ADX is rising: When one direction builds momentum, ADX will increase accordingly, showing the trend is getting stronger.
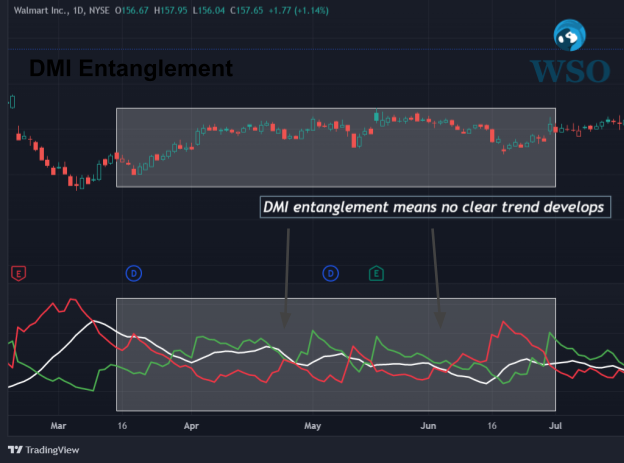
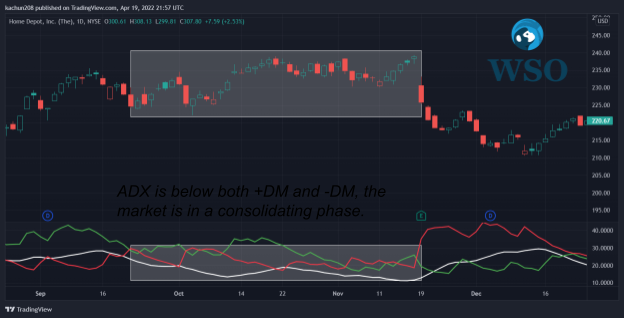
2. CONSOLIDATING Signal
When the market is in the consolidating phase, DMI and ADX will show the following signs:
- DMs Entanglement: When these two curves (+DM and -DM) entangle, the uptrend strength and the downtrend strength are relatively equal, and no clear trends develop.
- ADX below both DIs: When ADX is below +DI and -DI, the market is in a consolidating phase; no clear trend develops. Therefore, the price is expected to bounce within the price range.
Complimentary use of DMI
ADX is usually used with the DMI as a combination to predict the market trend; however, it is also possible for traders to use ADX alone to check the trend strength and momentum.
1. Trend strength
Trend strength measures the robustness of the support of an uptrend or the resistance of a downtrend:
- If the trend strength is muscular, the support or resistance for the trend is solid, showing no sign of trend reversal.
- If the trend strength is weak, the support or resistance for the trend is soft, showing a sign of potential correction or consolidation.
ADX is the exponential moving average of the DIs. It represents the trend strength as a lagging indicator, which means it can only give a signal to confirm a trend after it is formed.
The trend strength is indicated from 0 to 100.
- below 25: no trend or weak trend
- above 40: a strong trend
- above 50: a solid trend
A high index means a trend is formed; technical analysts mainly believe the direction will follow. Conversely, a low index implies the market is in a phase of accumulation or distribution; no significant movement is found.
Here are some typical scenes that the indicator might help to confirm the pattern:
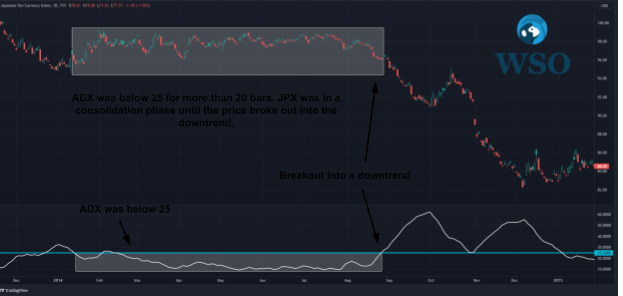
2. Consolidation Breakout
When the indicator is below 25 for more than 20 bars, it is suggested that the market has entered a consolidation phase with a precise price range, forming a price channel. Eventually, the price will break out into a trend with the index uprising.
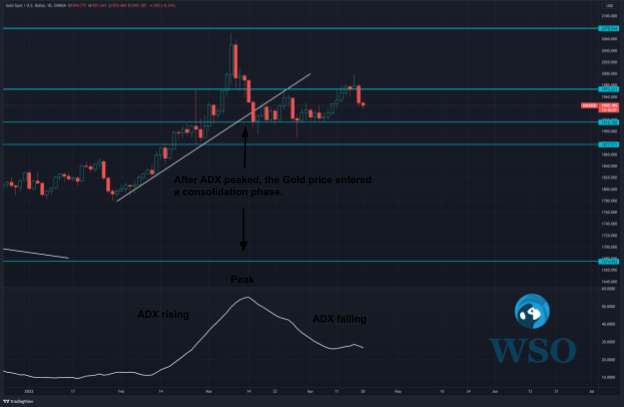
3. Trend reversal or consolidation
When the ADX curve is flattened from a steep shape, indicating the trend is losing momentum, the price might result in a possible but not necessary trend reversal or consolidation.
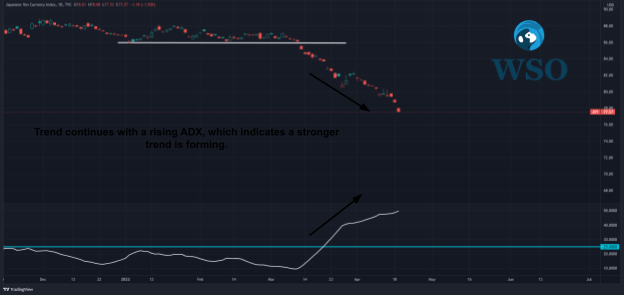
4. Trend continuation
When the indicator rises with the market trend, it indicates a trend continuation.
5. Trend momentum
Trend momentum is different from trend strength. Trend momentum means the velocity of money flowing in or out of the market.
Trend momentum means the extent of price actions following the same trend:
- If the trend momentum is strong, the price actions are decisive with the direction, which means it will have a steeper curve on the charts;
- If the trend momentum is weak, the price actions are inadequate with the trend, which means it will have a flatter curve on the charts.
The trend momentum can be observed from the peaks of the Average Directional Index.
- When the index's peak is rising, it means the market is gaining trend momentum.
- When the index's peak falls, the market loses trend momentum.
Application of DMI and ADX in trading strategies
Price actions are the core force of moving the market. It is a constant battle between the buyers and the sellers. And it forms a battleground between the two powers and leaves price patterns on charts.
From time to time, the battleground, i.e., the difference between asks and bids price, gets smaller and smaller, to a tipping point where the equilibrium fails, and one side is defeated to look for a new compromised price. This situation is known as the process of pattern breakouts.
All technical indicators are derived from the traces of price actions, which means all the indicators lag behind price actions. So, it is essential to read the price actions first, then read other indicators to understand if the momentum follows to form a potential new trend.
Directional Movement Index shows the possibility of price rising or falling within the last 14 bars, while ADX shows the trend's momentum. This indicator can help confirm a forming and allows traders to profit by following the trend.
A. Using DMI and ADX in trading breakouts
- Find out possible breakout patterns: Channels, triangles, support, resistance.
- When the price break out the way, check if DMs (+DM and -DM) cross each other:
- If yes, continue to check ADX
- If not, find another pattern
- Check ADX if it is higher than 25:
- If the index > 25, a possible trading setup
- If the index < 25, find another way or wait for the index to cross 25
- Checking if this is a buy or sell signal
- When +DM crosses -DM from under, it is a buy signal.
- When - DM crosses +DM from under, it is a sell signal.
- Make the trade with stop loss and target profit according to the pattern.
B. Using ADX in trading ranges
In trend trading, the Average Directional Index can be used to identify if a trend is formed.
- Find out the channel pattern, and check if ADX is lower than 25, which means there is not much strength for the market to break out.
- Given that index, trade between the channel range is lower than 25.
- When the index breaks 25, the channel might have been violated; range trading might not be an option under this condition.
DMI and ADX are solid technical indicators to show the trend strength. When used at the right place, i.e., the potential zone for reversal, it confirms a new trend, which is greatly useful for traders.
Limitations of using DMI and ADX
All beginner traders need to understand that all the technical indicators are not 100% accurate as most of them are derived from past price actions on charts. Therefore, they might not be reliable in predicting the future.DMI and ADX have the following weaknesses:
1. A lagging time for indicators to react
Both indicators are generated from past data, which requires a certain amount of time or an extent of price movement to reflect on the indicators.
2. No forecasting power over future events
Relying on past data, both indicators can't predict the future, especially in the case of sudden events.
3. Fake breakout of ADX going over 25.
When ADX is over 25, the trend strength is solid, but in a volatile market, ADX might top above 25 for a bit, then it might fall below 25 again, causing a false signal for technical traders.
Tips for trading
Generally, using only DMI and ADX might not be reliable enough for a trading setup. It is suggested to combine both indicators with other strategies like MACD, market patterns, candlestick patterns, etc., to gain a bigger market picture.
Always look for trends for your trading setups rather than in a range, as it will avoid ambiguity of price direction, leading you to a higher winning rate.
The average Directional Index will be your best weapon to determine whether a trend is formed. With ADX crossing 25, it ensures a certain amount of momentum is built with the current trend.
It does not guarantee a 100% success rate(as you were told in Trading 101, there is no 100% winning trading strategy), but it confirms a higher possibility of a definite trend.
I hope you will find your winning strategy with both indicators soon. Happy trading!
Directional Movement Index (DMI) FAQs

- Directional Movement Index is a combination of 3 independent indicators:
- Plus Directional Indicator (+DM),
- Minus Directional Indicator (-DM),
- Average Directional Index (ADX).
DMs represent the possibility of price direction compared to the last 14 days; ADX confirms if a trend is formed, not considering price direction. By combining the three indicators, technical traders better understand the market direction and the trend strength.
- The most common way to use DMI is that DM crosses with the ADX above 25.
- When ADX > 25, +DM crosses -DM from under, it means a Buy signal.
- When ADX > 25, -DM crosses +DM from under, which means a Sell signal.
And of course, it is not a guaranteed winning strategy; combining these technical indicators with trend patterns and candlestick patterns is believed to increase the winning rate.
Click here to check out how to set up in TradingView.

Edited by Colt DiGiovanni | LinkedIn
Free Resources:
To continue learning and advancing your career, check out these additional helpful WSO resources:


or Want to Sign up with your social account?