Double Bottom
Double bottom is a bullish chart pattern in technical analysis that signals a potential downtrend reversal.


What Is a Double Bottom?
A double bottom is a bullish chart pattern in technical analysis that signals a potential downtrend reversal. The pattern consists of two consecutive lows that are roughly equal, followed by a breakout above the high that separates the two lows.

The pattern is comprised of the following components:
- Downtrend: The asset is in a downtrend and is characterized by a series of lower lows and lower highs.
- First bottom: The asset price reaches a low point and bounces back up, forming the first "bottom" of the pattern.
- Reversal: The asset price retraces some of the declines but eventually falls back to test the previous low, forming the second "bottom" of the pattern.
- Breakout: The asset price then rises above the high formed between the two bottoms, signaling a potential trend reversal and the start of an uptrend.
Before making any trades, traders and analysts look for confirmation of the pattern, such as a break above the high formed between the two bottoms or a significant increase in trading volume.
The double-bottom pattern can also be used in combination with other technical indicators to increase the accuracy of the trend reversal signal.
Also, traders can look for possible bullish candlestick pattern formations so as to doubly ensure that the trade they choose works in their favor.
Trade Setup with a Double Bottom formation
To ensure that any pattern formed on stock charts is genuine and reliable, certain parameters must be met. For example, for the double-bottom pattern to work, the following conditions must be met.
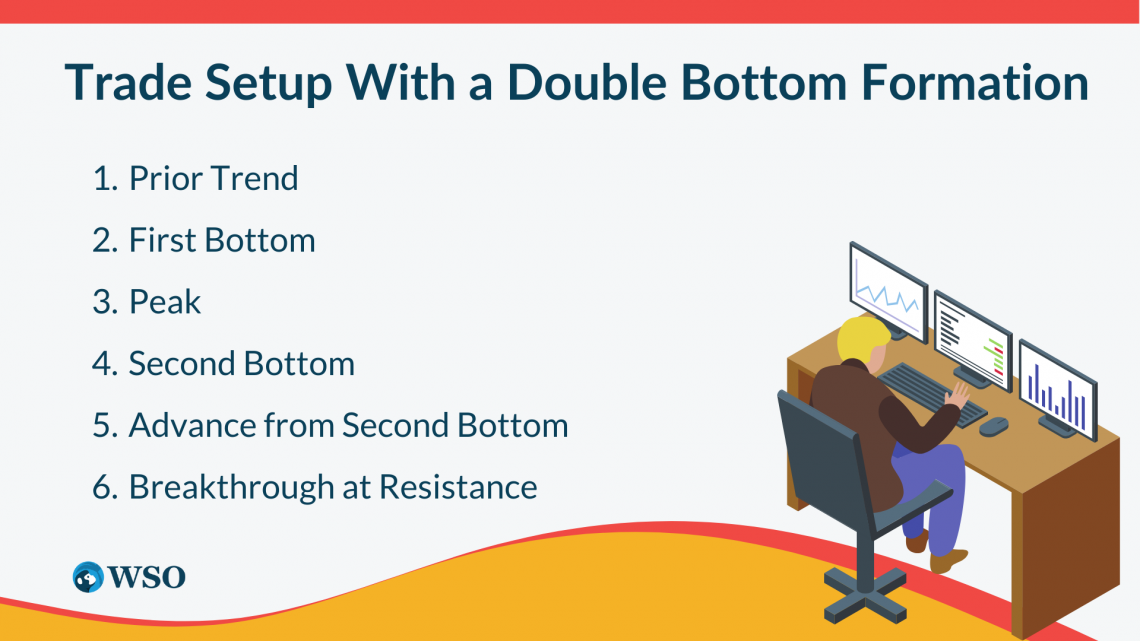
1. Prior Trend
For any reversal pattern to occur, an existing trend must be reversed. A major downtrend should be in place in the case of the double-bottom reversal.
2. First Bottom
The first bottom is the lowest point in the current trend. This point will later on in the pattern become a support zone.
3. Peak
Normally, there is a 10% to 20% advance after the first dip. Volume on the climb from the first bottom is frequently small, but a surge may imply early accumulation.
The peak's high is occasionally rounded or dragged out due to the delay in returning down. This pause suggests that demand is increasing but not sufficient to produce a breakout.
4. Second Bottom
After hitting a peak, the stock price dips again. The drop from the reaction high usually occurs with modest volume and meets support from the prior low.
If we notice the pattern on a daily chart, the interval between the two bottoms should be at least two weeks. While perfect bottoms are preferred, there is some leeway; normally, a bottom within 3% of its predecessor is accepted.
5. Advance from the Second Bottom
After hitting the low for the second time, the stock recovers and rebounds once again. Also, the volume and purchasing pressure accelerates during the rally after the second dip.
6. Breakthrough at Resistance
The double-bottom is still in progress even after the price has moved up to the resistance. The resistance, in this case, is the peak formed after the first trough.
The pattern is complete when this resistance is broken in conjunction with a rise in volume and/or speed.
Below is a visual representation of a double-bottom pattern formation.
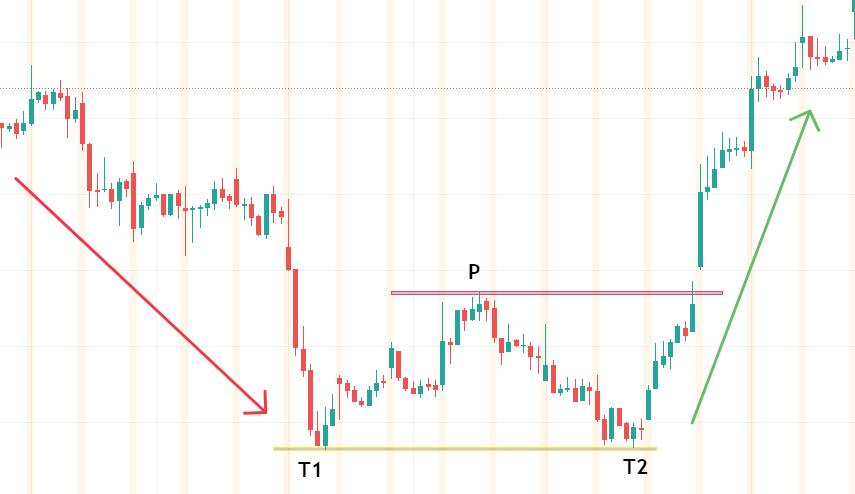
The red arrow indicates a prior trend (downtrend). The bottom-most point of this downtrend (T1) is our first bottom, and the yellow line is our support zone.
Following the first dip, the stock price moves up again, forming the peak (P). This is the point at which the trend will have to break later on after it bounces back after dipping. Hence, the price level of P is our resistance zone (marked by the purple line).
After forming the peak, the price dips back again to the same level as that of T1 to form the second bottom and takes support.
After the formation of the second bottom, the price rebounds again, this time with a greater speed and higher volumes. In some time, the price breaks the resistance formed at point P. Hence, a double bottom is confirmed. The green arrow represents the uptrend that follows.
How is Trading Done During a Double Bottom
Let us bring what we have learned into practical application and pick the right trade using a double-bottom formation on the price charts of Balrampur Chini Mills (a firm listed on the National Stock Exchange of India).
Below is the hourly chart of Balrampur Chini Mills. The red arrow shows that the stock is in a downtrend, and the stock makes the first bottom at point T1. At T1, the price of this stock is INR 356.55.
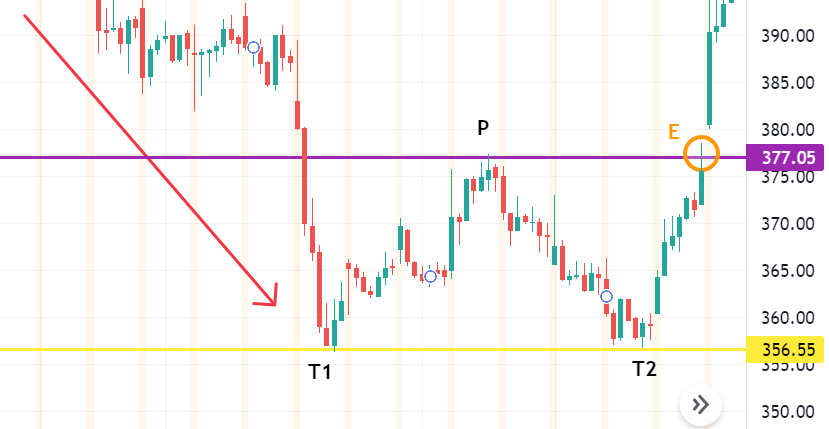
After hitting bottom, the stock price rebounds and forms a peak (P) at INR 377.05. This price point will later on act as the resistance zone that the stock will have to break out.
Balrampur Chini Mills then saw a dip in its price and hit the same levels it had before, i.e., INR 356.55. It forms the second bottom (T2) here and takes support from the price zone. The stock price then rebounds.
At point E, we finally get an entry signal when the price breaks through the resistance level formed by P. We have now confirmed the formation of a double-bottom pattern. Hence, we can make the following trade setup:
1. Entry
We enter when the price level breaks the resistance zone. In this case, we initiate a long position at INR 377.05.
2. Target
To estimate the target, add the distance from the resistance breakout to the bottoms of the formation (this implies that the larger the formation, the greater the potential advance).
In our scenario, this distance is 377.05 - 356.55 = 21.3 points. Therefore, the target is 377.05 + 21.3 = 398.35.
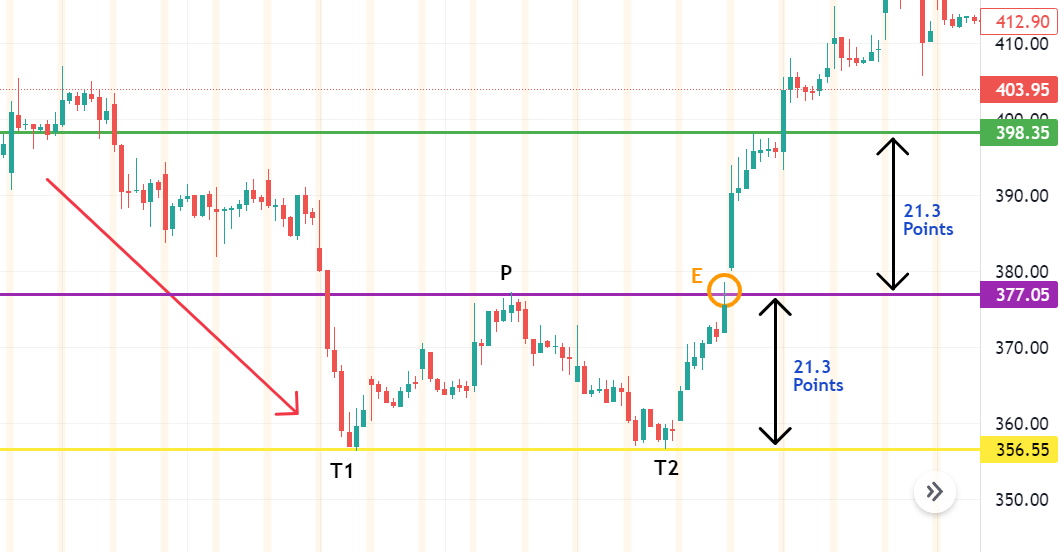
You can see that the trade we chose was a successful one, and we comfortably reached the desired target.
Note
You've probably observed that the price has broken through and rallied over the target level. Such movements, however, are highly unpredictable, and it is difficult to time the markets so that you may purchase low and sell high. That is why it is vital to establish targets and book profits.
Limitations of the Double Bottom Pattern
While double bottoms can be a useful tool for traders, there are also some limitations to this pattern that traders should be aware of.
1. False Signals
One of the biggest drawbacks of double bottoms is that they might occasionally produce false signals.
For example, the price may bounce off the support level created by the first low but then continue to drop and breakthrough that level. As a result, traders may establish long positions based on the pattern's creation, only to see the price continue to fall.
2. Ambiguity
Another drawback of double bottoms is that they can be unclear at times. In some circumstances, determining whether a pattern is a double bottom or just random price changes might be challenging. This can lead to confusion and potentially incorrect trading decisions.
One reason for this ambiguity is that double bottoms are a subjective pattern. Despite its well-defined basic structure, a double bottom can vary in the exact locations of the two lows, the time between them, and the peak height in between.
This can make determining if a given pattern satisfies the criteria for a double bottom challenging for traders.
3. Influence of Market Noise
Another disadvantage of double bottoms is that they are susceptible to market noise. Market noise refers to random price changes that have nothing to do with any underlying fundamental reasons. This can make identifying meaningful trends in price data challenging.
4. Limited applicability
Double bottoms are typically more effective in markets with lower volatility. Patterns may not form clearly in high-volatility markets, making it difficult to spot double bottoms.
Double Bottom FAQs

Yes, a double-bottom pattern can fail. While a double-bottom is a bullish reversal pattern, several factors, such as lack of sufficient buying pressure or a significant fundamental change affecting the underlying asset, can cause the pattern to fail.
A triple bottom formation is a bullish reversal pattern that is similar to a double bottom but with three lows instead of two.
When the price of an asset falls to a certain level, bounces back up, falls back down to the same level, rebounds back up again, and then falls back down to the same level for a third time before eventually breaking above the resistance level, a triple bottom pattern is established.
The inverse of a double-bottom pattern is called a double-top pattern. While the double-bottom pattern signals a potential reversal of a downtrend, the double-top pattern signals a potential reversal of an uptrend.
The double-top pattern consists of two consecutive peaks that are roughly equal, followed by a breakdown below the support level formed by a low that separates the two peaks.


or Want to Sign up with your social account?