Dow 30
A stock market index of 30 well-known firms listed on American stock exchanges.
A stock market index of 30 well-known firms listed on American stock exchanges is called the Dow Jones Industrial Average, DJIA, Dow Jones, or simply the Dow or Dow 30.

The S&P 500, a complete market index, is viewed by many analysts as providing a more realistic picture of the U.S. stock market as a whole, despite DJIA being one of the most well-known and often used equities indexes.
In the DJIA, just 30 significant companies are represented. Like stock indexes, it uses price weighting rather than market capitalization. Additionally, the DJIA does not employ a weighted summation.
Thirty significant American corporations' stock prices are monitored by the Dow Jones Industrial Average (DJIA). Some examples of these businesses include Apple Inc., Boeing, and Goldman Sachs.
Except for utilities and transportation, the chosen businesses represent every significant American industry.
When there is a substantial change in the economy that has to be represented in the composition, the index alters when one or more components face financial difficulties that make them a less critical firm in their industry.
The index's makeup evolves along with the economy throughout time. When a firm ceases to be relevant to contemporary economic developments, it may lose its spot in the Dow and be replaced with a new name that more accurately represents the change.
The Dow may remove a company from it if it has significant market capitalization losses as a consequence of financial issues.

The number of outstanding shares is multiplied by the stock price to get a company's market capitalization. The index gives stocks with higher share prices more weight.
Therefore, a higher percentage change in a more expensive component will considerably affect the total determined value.
Charles Dow determined the average at the Dow's debut by summing the values of the twelve stocks that made up the Dow and dividing by twelve. The outcome was an easy average.
The index has undergone additions and deletions throughout time due to stock splits and mergers that needed to be considered. A straightforward mean computation was now illogical.
In March 1999, the Dow Jones Industrial Average (DJIA) reached 10,000 for the first time. The DJIA reached 11,750 in January 2000 until the dot-com meltdown in October 2002 caused it to decline to below 7,200.
How does DOW 30 Operate & Its Calculation
The Dow Jones Industrial Average was developed to track the movements of the top American businesses involved in industrial activity. It uses a price-weighted index, which gives stocks with higher share prices more weight in the index than those with lower share prices.
When divided by the divisor, it represents the total cost of one share of stock for all of the constituents. Since all component stocks move in one-point increments, the index will also move in one-point increments.

By adding up and dividing by 12 the stock prices of the 12 companies, the Dow first calculated the averages.
The index's formula was later modified to reflect the relative significance of each constituent depending on what proportion of the index's total value it indicated.
The price of the 30 corporations that make up the Dow Jones Industrial Average is combined and then divided by a factor known as the Dow Divisor to create the price-weighted index that it is today.
The Divisor's purpose is to mitigate the impact of certain structural modifications, including stock splits.
The total of the component prices is frequently affected by stock splits and changes to the list of the firms that make up the index.
In these circumstances, the Dow divisor is changed so that the quotes just before and after the incident coincides with preventing discontinuity in the index.
The Stocks and Components of DJIA
To replace firms that no longer satisfy the listing requirements with those that do, the Dow is often revised.
The index developed into 30 constituent companies by 1928. Since then, it has undergone several compositional changes.
Several adjustments were made to its constituent parts during its early years, generally up until the Great Depression. The first significant modification occurred in 1932 when eight equities in the Dow were changed.

Before 2020, 1997 was the last time the Dow's composition underwent a significant shift relating to the changes made in its Constituent stocks.
For example, Travelers' Group took the place of Westinghouse Electric; Johnson & Johnson took the place of Bethlehem Steel; Hewlett-Packard took the place of Texaco, and Wal-Mart took the place of Woolworth's.
Hence the index leaned more toward the tech and engineering industry. Walgreens Boots Alliance, Inc. succeeded General Electric Company on June 26, 2018.
Furthermore, DowDuPont separated from DuPont and was replaced by Dow Chemical Company in 2020 and 2019, respectively, while United Technologies amalgamated with Raytheon Company, and the new company joined the index as Raytheon Technologies.
Again we see more of an inclination toward the tech and engineering industry.
| Company Name | Stock Name | Year | |
|---|---|---|---|
| 1 | 3M | MMM | 1976 |
| 2 | American Express | AXP | 1982 |
| 3 | Amgen | AMGN | 2020 |
| 4 | Apple Inc. | AAPL | 2015 |
| 5 | Boeing | BA | 1987 |
| 6 | Caterpillar | CAT | 1991 |
| 7 | Chevron Corp. | CVX | 2008 |
| 8 | Cisco System | CSCO | 2009 |
| 9 | The Coca-Cola Company | KO | 1987 |
| 10 | Dow Inc. | Dow | 2019 |
| 11 | Goldman Sachs | GS | 2013 |
| 12 | The Home Depot | HD | 1999 |
| 13 | Honeywell | HON | 2020 |
| 14 | IBM | IBM | 1979 |
| 15 | Intel | INTC | 1999 |
| 16 | Johnson & Johnson | JNJ | 1997 |
| 17 | JPMorgan Chase | JPM | 1991 |
| 18 | McDonald’s | MCD | 1985 |
| 19 | Merck & Co. | MRK | 1979 |
| 20 | Microsoft | MSFT | 1999 |
| 21 | Nike Inc. | NKE | 2013 |
| 22 | Proctor & Gamble | PG | 1932 |
| 23 | Salesforce | CRM | 2020 |
| 24 | The Travelers Companies | TRV | 2009 |
| 25 | United Health Group | UNH | 2012 |
| 26 | Verizon | VZ | 2004 |
| 27 | Visa | V | 2013 |
| 28 | Walmart | WMT | 1997 |
| 29 | Walgreens Boots Alliance | WBA | 2018 |
| 30 | The Walt Disney Company | DIS | 1991 |
Initial Stages & Early Years (History) of DJIA
The index was at a level of 62.76 when it was originally published in the middle of the 1880s. It peaked at 78.38 during the summer of 1890, but the Panic of 1896 ultimately caused it to fall to an all-time low of 28.48.
Early in the Dow's history, as the developing industrial economy matured, many of the largest percentage price changes took place.
The Panic of 1901 and the Panic of 1907 caused two economic collapses that caused the Dow Jones to lose pace in the 1900s.
Up to the end of 1914, the Dow was trapped between 53 and 103. The aftermath of the 1906 San Francisco earthquake was largely negative for the economy, and the index hit 100.
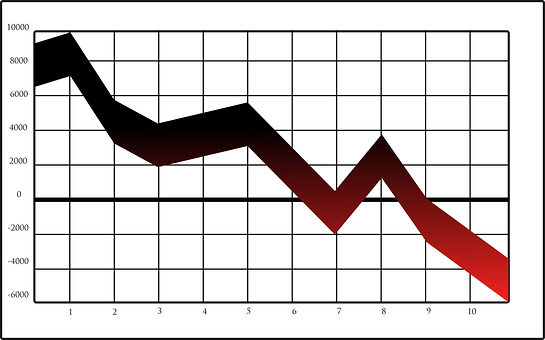
The Panic of 1910-1911 hampered economic development at the start of the 1910s. On July 30, 1914, with the average at 71.42, the decision was made to close the New York Stock Exchange and cease trading for four and a half months.
Some historians believe the exchange was stopped due to fears that markets might crash due to the outbreak of World War I.
The exchange was closed by the United States Secretary of the Treasury, William Gibbs McAdoo, to save the United States gold stock in preparation for the creation of the Federal Reserve System.
Later that year, with enough gold to maintain the United States on par with the gold standard. The index ended at 74.56 when the markets reopened on December 12, 1914. This is typically stated as a significant decline as a result of employing a later redefinition.
From 1920 through late 1929, the Dow underwent a long bull run, rising from 73 to 381 points. The Dow Jones Industrial Average was expanded to 30 equities at the end of the Roaring Twenties when the economy peaked.
The impact of the 1920-21 Depression and various foreign wars such as the Polish-Soviet War, the Irish Civil War, the Turkish War of Independence, and the early stages of the Chinese Civil War was minimized during this period.
After reaching a high of 381.17 on September 3, 1929, the 1929 collapse bottomed out barely two months later on November 13, 1929, at 195.35 intraday, ending slightly higher at 198.69.
The 1929 Wall Street Crash and the accompanying Great Depression reduced the average to its starting point, about 90% below its high.
Overall, the Dow rose 131.7 percent throughout the 1920s decade, from 107.23 to 248.48 at the end of 1929.
In inflation-adjusted terms, the high of 381.17 on September 3, 1929, was not equaled until 1954.
The 1930s were marked by global instability, the Great Depression, and many major European and Asian outbreaks of conflict, building up to the tragic World War II in 1939.
Other hostilities that influenced the stock market throughout the decade were the 1936-1939 Spanish Civil War, the 1935-1936 Second Italo-Abyssinian War, the Soviet-Japanese Border War of 1939, and the 1937 Second Sino-Japanese War.

The Recession of 1937–1938, which hit the United States, momentarily halted economic growth. In the 1930s bear market depths, on March 15, 1933, the Dow gained the most percentage point in a single day to close at 62.10.
However, the Dow produced some of its worst results during the Great Depression, giving novice and experienced stock market investors a negative return during the majority of the 1930s.
The Dow Jones average lost nearly 40% of its value throughout the decade, falling from 248.48 at the start of 1930 to a constant level of 150.24 by 1939.
The Dow rose by 33 percent from 150.24 to 200.13 in the 1940s as a result of post-war reconstruction and fresh hope for peace and prosperity. The 1949 Recession and other international crises did not affect the Dow's strength.
The Cold War and the Korean War did not halt the Dow's ascent throughout the 1950s. Over the next ten years, the average rose from 200.13 to 679.36, a roughly 240 percent rise.
The Kennedy Slide of 1962 caused the markets to slog through the 1960s, but the DJIA still recorded an 18% rise from 679.4 to 800.4.
The 2008 Market Crash & DJIA’s Reaction to it
On October 11, 2007, the Dow achieved a record high of 14,198.10, which wasn't surpassed until March 2013. Due to the financial crisis of 2007–2008, it then declined for the following year.

When Lehman Brothers declared bankruptcy on September 15, 2008, the economic impact of record-high oil prices—which had hit over $150 per barrel two months earlier—and the record-high oil prices themselves became apparent.
The DJIA dropped more than 500 points for the day, dropping back to its lows of less than 11,000 in the middle of July.
The Federal Reserve and the US Department of the Treasury planned and implemented a number of rescue plans, including the Emergency Economic Stabilization Act of 2008, but they were unable to stop additional losses.
The Dow had its highest one-day point loss, largest daily point gain, and widest intraday range of more than 1,000 points during the almost six months of intense volatility, and on March 9, 2009, the index finished at a new 12-year low of 6,547.05, its lowest closing since April 1997.
In just six weeks, the Dow had dropped by 20%.
With hopes that the financial crisis of 2007–2008, the housing bubble in the United States, and the Late 2000s recession were diminishing and perhaps coming to a close, the average rose approaching the 10,000 mark in the second half of 2009.
The Dow experienced a rather significant decline for a negative return for the decade, falling from 11,497.12 to 10,428.05, a loss of 9.3 percent.
Constraints & Drawbacks of DJIA
There are certain drawbacks to the DJIA, despite it being one of the most significant stock market activity gauges.
The DJIA, which consists of only 30 constituent stocks, is not the best predictor of how the market as a whole is performing, given that over 5,300 common stocks are listed on the NASDAQ and NYSE.

A depiction of the stock market that is less than 1% of the entire market may be inaccurate and may not reflect the actual status of the economy.
According to experts, considering a company's market value rather than just the stock price in the computation would more truly reflect it.
Accordingly, a firm with a higher stock price but a lower market cap would be given more weight than a company with a higher stock price but a bigger market cap, which would be a poor representation of a corporation's accurate and current value.
Additionally, using a price-weighted index rather than a market-weighted one favors some DJIA components over others.
Since the S&P 500 Index, Russell 2000 index and Wilshire 5000 Index are alternative indices, professional fund managers use them to track the stock market's overall performance. The indexes represent about 9.4% to 94% of the stock market fluctuations.
According to research, when equities are falling in value, the connection between the Dow Jones Industrial Average's components and the index's movement is stronger. The connection is lowest when the average is stable or very slightly rising.


or Want to Sign up with your social account?