Kicker Pattern
A trading strategy that involves a sudden price movement followed by a reversal.


What Is a Kicker Pattern?
The kicker pattern is a two-candlestick reversal pattern that occurs in financial markets. It is a rare pattern that can appear in any timeframe and market, including stocks, currencies, and commodities.
The pattern is characterized by a sudden price gap or jumps in the opposite direction of the prevailing trend, followed by a continuation of the trend in this direction. This sudden shift in market sentiment can be a strong signal for traders to enter or exit a position.
The first candle in this pattern is a long candle in the direction of the prevailing trend. The second candle is a long candle that moves in the opposite direction of the trend and has a price gap between the two candles. The second candle is typically larger than the first one and closes near its high or low.
Depending on the trend's direction and the pattern that develops, the kicker can be a bullish or a bearish pattern.
A bullish kicker occurs when the first candle is a bearish candle and the second candle is a bullish candle. This signals a reversal of the previous downtrend and a potential uptrend.
On the other hand, a bearish kicker occurs when the first candle is bullish and the second candle is bearish. This signals a reversal of the previous uptrend and a potential downtrend.
Note
It is important to note that the kicker pattern is a rare occurrence and should be confirmed by other technical indicators and analysis before making any trading decisions. Traders should also consider factors such as volume and price action to validate the pattern.
- The kicker pattern is a two-candlestick reversal pattern characterized by a sudden price gap or jump in the opposite direction of the prevailing trend, followed by a continuation of the trend in this direction.
- Depending on the trend's direction and the pattern that develops, the kicker can be a bullish or a bearish pattern.
- The bullish kicker is the bullish version of the kicker pattern, which signals a potential reversal of a previous downtrend and a potential uptrend.
- The first candle in the bullish kicker is bearish and in the direction of the previous downtrend. The second candle is a long bullish candle that moves in the opposite direction of the trend and opens a gap-up above the high/close of the previous candle.
- The bearish kicker is the bearish version of the kicker pattern, which signals a potential reversal of a previous uptrend and a potential downtrend.
- The first candle in the bearish kicker is bullish and in the direction of the previous uptrend. The second candle is a long bearish candle that moves in the opposite direction of the trend and opens a gap-down below the low/close of the previous candle.
- The kicker is a strong signal for a reversal of the previous trend. It is a simple and straightforward pattern validated by price action.
- However, the kicker pattern is a rare occurrence, and the pattern is a lagging indicator. Moreover, this pattern may generate false signals like any other technical indicator.
The Bullish Kicker Pattern
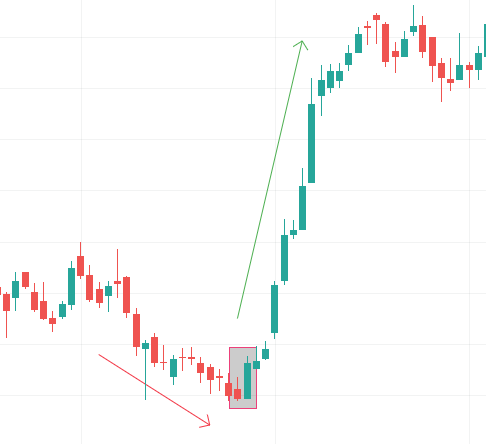
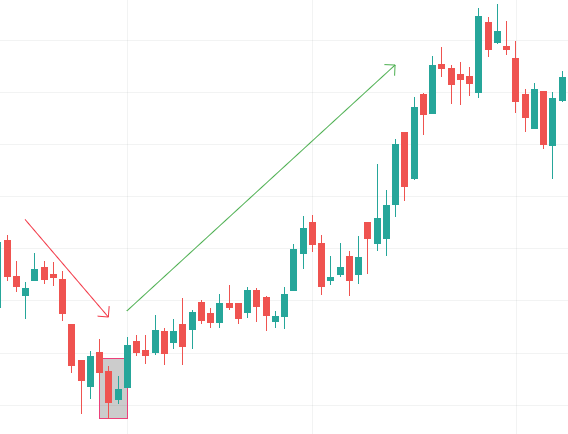
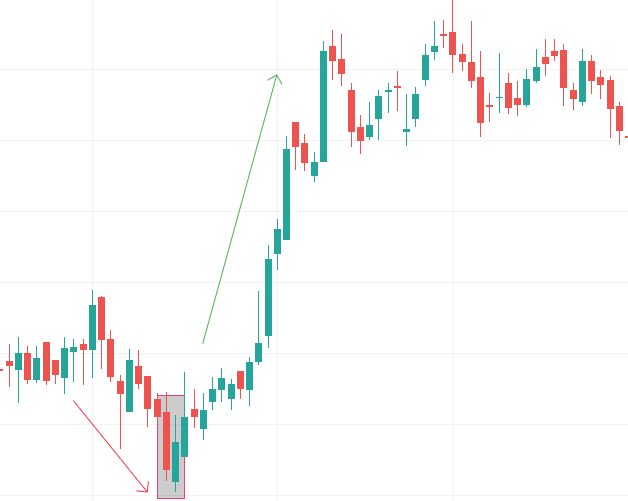
The bullish kicker is the bullish version of the kicker pattern. It is a two-candlestick reversal pattern, which signals a potential reversal of a previous downtrend and a potential uptrend.
The first candle in the bullish kicker is a bearish candle that is in the direction of the previous downtrend.
The second candle is a long bullish candle that moves in the opposite direction of the trend. This candle opens above the high/close of the previous candle, and the price opens a gap-up. The second candle is larger than the first, indicating strong bullish momentum.
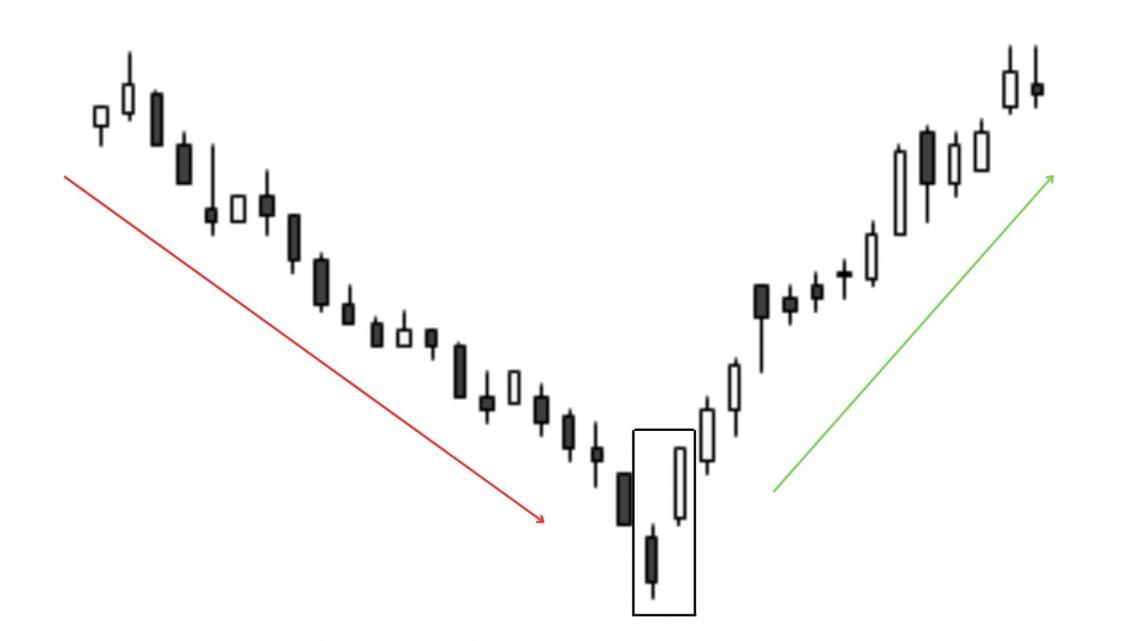
You can see how a bullish kicker is formed on the abovementioned price chart. The underlying is in a downtrend before a bullish kicker is formed (represented by the two candlesticks in the box). After the pattern is formed, the price moves upwards.
Note
The gap between the two candles is a significant feature of the kicker pattern. The gap represents a sudden shift in market sentiment, leading to a price jump in the opposite direction of the previous trend.
The trading psychology behind the bullish kicker can be explained as follows:
- The underlying was experiencing a decline in the price, and the bears were in control of the market.
- In the first period of the pattern formation (when the first candlestick is formed), the price of the underlying declines further and forms a new low.
- In the second period of the pattern formation (when the second candle is formed), there is an unexpected purchasing demand, so much so that the underlying opens a gap-up.
- The purchasing demand persists, and the underlying forms a long, bullish candle.
- The price movement in the second period also suggests that bulls tried to break the bearish trend rather abruptly and forcefully and were mostly successful.
- The bears would not have predicted the bulls' swift movement in the second period. As a result, the bulls' actions make the bears nervous.
- The following trading periods are expected to be positive, driving up prices. As a result, traders should look for opportunities to buy.
The Bearish Kicker Pattern
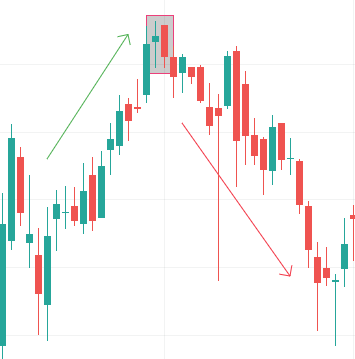
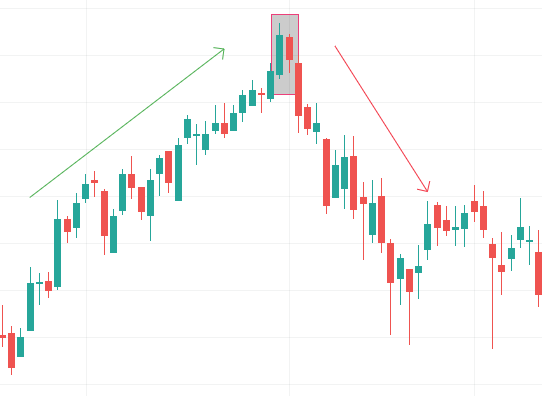
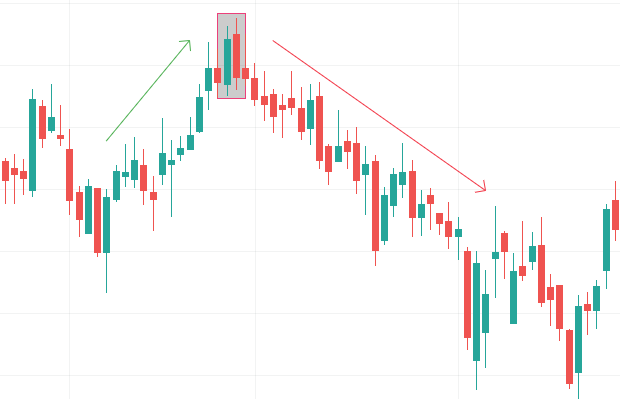
The bearish kicker is the bearish version of the kicker pattern. It is a two-candlestick reversal pattern, which signals a potential reversal of a previous uptrend and a potential downtrend.
The first candle in this pattern is a bullish candle in the direction of the previous uptrend.
The second candle is a long bearish candle that moves in the opposite direction of the trend. This candle opens below the low/close of the previous candle, and the price opens a gap-down. The second candle is typically larger than the first, indicating strong bearish momentum.
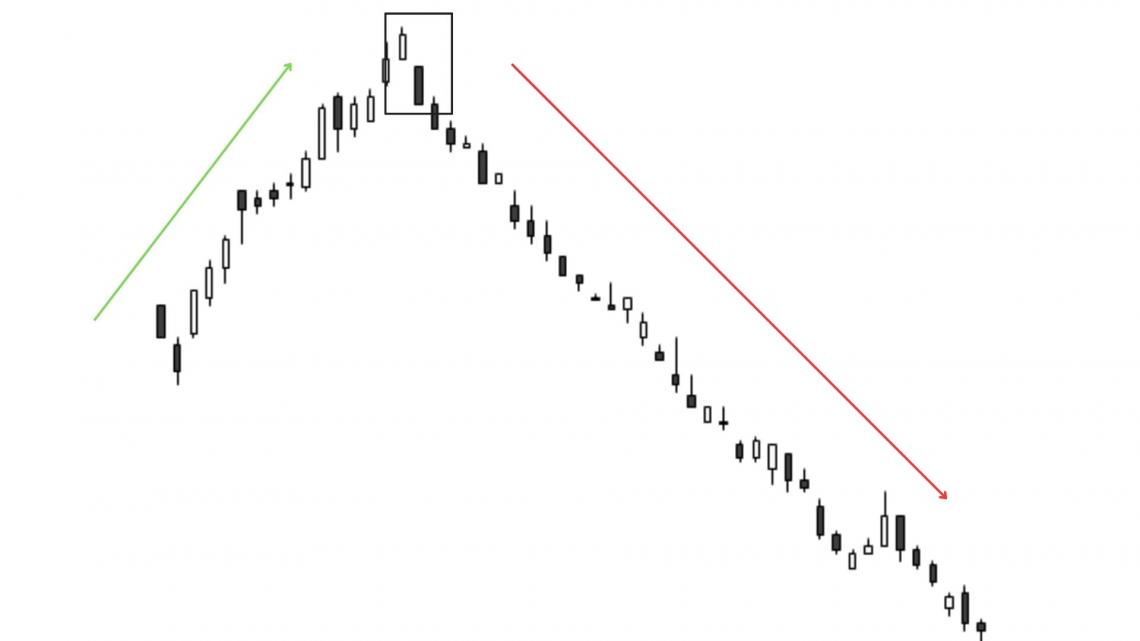
In the chart above, you can see how a bearish kicker is formed. As you can see, the underlying was in an uptrend before the formation of a bearish kicker (represented by the rectangular box). After the formation of this pattern, you can see the price decline that followed.
The trading psychology behind the bearish kicker can be explained as follows:
- The underlying was experiencing an uptrend, and the bulls were in control of the market.
- In the first period of the pattern formation (when the first candlestick is formed), the price of the underlying rises further and forms a new high.
- In the second period of the pattern formation (when the second candle is formed), there is unexpected selling, and the underlying opens a gap-down.
- Aggressive selling persists, so much so that the underlying forms a long, bearish candle.
- The price movement in the second period also suggests that bears tried to break the bullish trend rather abruptly and forcefully, and they were quite successful.
- The bulls would not have anticipated such rapid movement from bears in the second period. As a result, the bears' actions make the bulls nervous.
- The following few trading periods are expected to be bearish, and a decline in the underlying price is anticipated. Hence, traders should look for shorting opportunities.
Pros and Cons of Trading with Kicker Pattern
Like any other trading strategy, the kicker pattern has its own set of advantages and disadvantages. Below mentioned are a few pros and cons of using this pattern.
The pros are:
1. Strong Signal for Reversal
The kicker pattern is a strong signal for a reversal of the previous trend, indicating a potential trend change. This can help traders to identify potential entry and exit points for their positions.
2. Clear and Simple
The kicker pattern is simple, straightforward, and easy to recognize, making it an ideal choice for novice traders learning to read candlestick charts.
The criteria for identifying this pattern are objective and well-defined, making it easier for traders to use them in their analysis and decision-making.
3. Validated by Price Action
The kicker pattern is validated by price action, which is an important factor in confirming the validity of a pattern. In addition, the sudden shift in market sentiment represented by the gap between the two candles in this pattern is an important factor in validating the pattern.
The cons are:
1. Rare Occurrence
Kicker patterns are relatively rare and may not occur frequently enough to be a reliable trading strategy on their own. As a result, traders may need to supplement their analysis with other technical indicators or strategies to identify potential trading opportunities.
2. False Signals
Like any technical indicator, kicker patterns are not infallible and can produce false signals. Therefore, traders should use additional technical analysis and market context to confirm the pattern before taking any trading action.
3. Late Confirmation
Kicker patterns are a reversal signal, which means they may occur after the market has already started to reverse. This can result in missed trading opportunities or entering trades at less favorable prices.
Other Candlestick Patterns to watch out for
Besides the kicker, traders can use various candlestick patterns to identify trend reversals. Some of them are
1. Bullish engulfing
The bullish engulfing pattern is a two-candlestick pattern that occurs at the end of a downtrend when a small bearish candlestick is followed by a larger bullish candlestick that completely engulfs the previous candlestick. It is a bullish reversal signal.
2. Bearish engulfing
The bearish engulfing pattern is a two-candlestick pattern that occurs at the end of an uptrend when a small bullish candlestick is followed by a larger bearish candlestick that completely engulfs the previous candlestick. It is a bearish reversal signal.
3. Bullish harami
The bullish harami pattern is a two-candlestick pattern that occurs at the bottom of a downtrend when a large bearish candlestick is followed by a small bullish candlestick entirely contained within the range of the previous candlestick. It is a bullish reversal signal.
4. Bearish harami
The bearish harami pattern is a two-candlestick pattern that occurs at the end of an uptrend when a large bullish candlestick is followed by a small bearish candlestick that is entirely contained within the range of the previous candlestick. It is a bearish reversal signal.
5. Piercing pattern
The piercing pattern is a two-candlestick pattern that occurs at the bottom of a downtrend when a long bearish candlestick is followed by a bullish candlestick, which opens below the previous candlestick’s closing price but closes above the midpoint of the previous candlestick. It is a bullish reversal signal.
6. Dark cloud cover
The piercing pattern is a two-candlestick pattern that occurs at the top of an uptrend when a long bullish candlestick is followed by a bearish candlestick, which opens above the previous candlestick’s closing price but closes below the midpoint of the previous candlestick. It is a bearish reversal signal.


or Want to Sign up with your social account?