Charts And Figures Template
Present your numbers using charts and figures


Last Updated:October 29, 2024
Download WSO's free Charts & Figures PowerPoint template below!
This template allows you to showcase some of your financial numbers with graphs and charts.
The template is plug-and-play, and you can enter your own text or numbers. The template also includes other slide pages for other elements of a financial model presentation. According to the WSO Dictionary,
"Charts, figures, and graphics are typically used to present raw data, not when you want to show a relationship between variables."
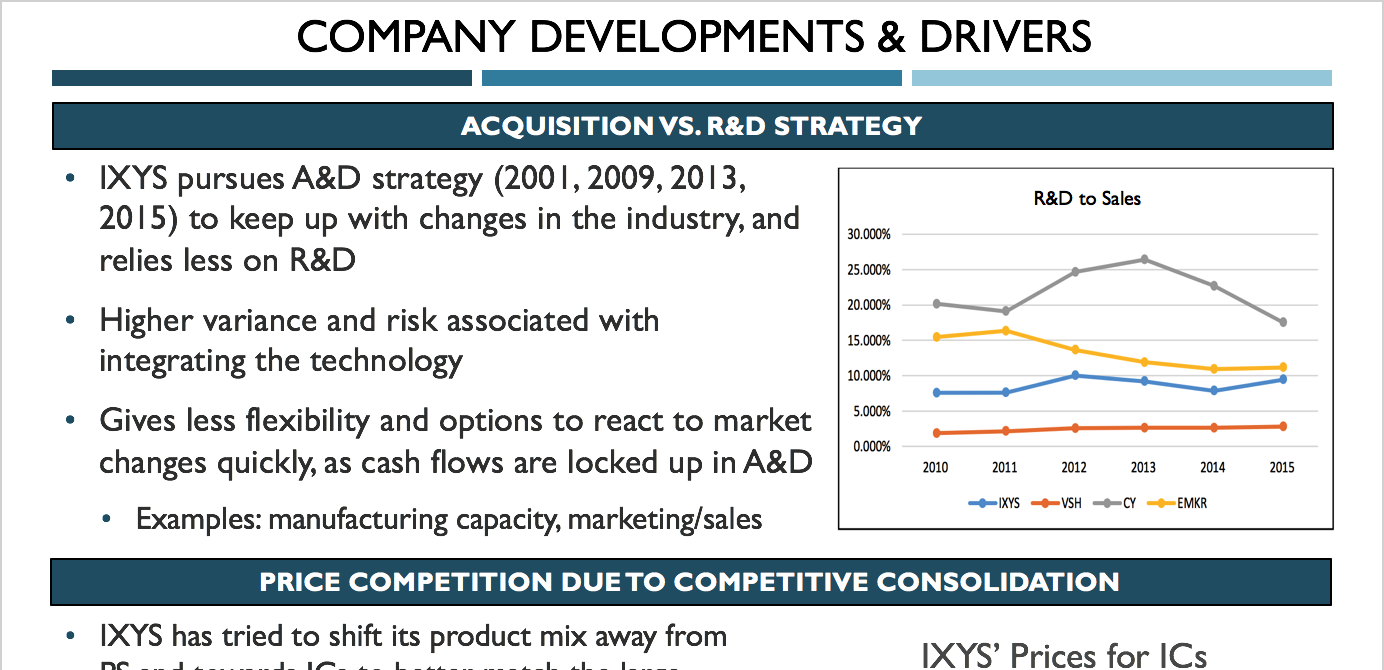
A screenshot below gives you a sneak peek of the template.

More Resources:
We hope this template helps you excel at your job! Please check out the following additional resources to help you advance your career:


or Want to Sign up with your social account?