Moodys Corporation Overview
The Overall Ranking is a score from 1 star (very bad) to 5 stars (excellent) generated based on the Company Reviews of current and former employees at this company, taking everything into account.
The number you see in the middle of the donut pie chart is the simple average of these scores. If you hover over the various sections of the donut, you will see the % breakdown of each score given.
The percentile score in the title is calculated across the entire Company Database and uses an adjusted score based on Bayesian Estimates (to account for companies that have few reviews). Simply put, as a company gets more reviews, the confidence of a "true score" increases so it is pulled closer to its simple average and away from the average of the entire dataset.
- 5 Stars
- 4 Stars
- 3 Stars
- 2 Stars
- 1 Star
Moodys Corporation Job Openings
Program Name | Industry | Company Type | Group / Division / Type | Role Type | Region | Current Status | Stage Triggered | Opening | Closing | Actual | Description | Track |
---|---|---|---|---|---|---|---|---|---|---|---|---|
Ratings and Research Support Working Student - Corporate Finance Group | Equity Research | Miscellaneous | Corporate Finance, Research | Full Time | EMEA | Open | Track | |||||
Ratings and Research Support Intern - Corporate Finance Group | Equity Research | Miscellaneous | Corporate Finance, Research | Internship | EMEA | Open | Track | |||||
Ratings and Research Support Working Student - Structured Finance | Equity Research | Miscellaneous | Finance, Research | Internship | EMEA | Open | Track | |||||
Project Management Intern | Equity Research | Miscellaneous | Project Finance | Internship | EMEA | Open | Track | |||||
Ratings and Research Support Intern - Sovereign/Sub-Sovereign Group | Equity Research | Miscellaneous | Research | Internship | EMEA | Open | Track | |||||
Structured Finance Intern | Equity Research | Miscellaneous | Finance, Structured Products | Internship | South America | Open | Track | |||||
Financial Institutions Intern | Equity Research | Miscellaneous | Financial Institutions Group (FIG) | Internship | South America | Open | Track | |||||
Ratings and Research Support Intern | Equity Research | Miscellaneous | Research | Internship | South America | Open | Track | |||||
Credit Analyst Intern | Equity Research | Miscellaneous | Analytics, Credit | Internship | South America | Open | Track | |||||
Ratings Associate - Structured Finance Group | Equity Research | Miscellaneous | Structured Products | Full Time | US | Open | Track |
Moodys Corporation Stats
The average hours worked chart shows the distribution of average hours worked per week generated based on the Compensation data at this company.
The number you see in the middle of the doughnut pie chart is the adjusted average of these scores. If you hover over the various sections of the donut, you will see the % breakdown of each workload given.
The percentile score in the title is calculated across the entire Company Database and uses an adjusted score based on Bayesian Estimates (to account for companies that have few interview insights). Simply put, as a company gets more data points, the confidence of a "true measure" increases so it is pulled closer to its simple average and away from the average of the entire dataset.
- 10-20 Hrs
- 20-30 Hrs
- 30-40 Hrs
- 40-50 Hrs
- 50-60 Hrs
- 60-70 Hrs
- 70-80 Hrs
- 80-90 Hrs
- Over 90 Hrs
The Interview Experience is a score from 1 star (very negative) to 5 stars (very positive) generated based on the Interview Insights at this company.
The number you see in the middle of the doughnut pie chart is the simple average of these scores. If you hover over the various sections of the donut, you will see the % breakdown of each score given.
The percentile score in the title is calculated across the entire Company Database and uses an adjusted score based on Bayesian Estimates (to account for companies that have few interview insights). Simply put, as a company gets more reviews, the confidence of a "true score" increases so it is pulled closer to its simple average and away from the average of the entire dataset.
- Very Negative
- Negative
- Neutral
- Positive
- Very Positive
The Relative Compensation is a score from 1 star (very bad) to 5 stars (excellent) generated based on the Company Reviews of current and former employees at this company based on relative pay.
The number you see in the middle of the donut pie chart is the simple average of these scores. If you hover over the various sections of the donut, you will see the % breakdown of each score given.
The percentile score in the title is calculated across the entire Company Database and uses an adjusted score based on Bayesian Estimates (to account for companies that have few reviews). Simply put, as a company gets more reviews, the confidence of a "true score" increases so it is pulled closer to its simple average and away from the average of the entire dataset.
- 1 Star
- 2 Stars
- 3 Stars
- 4 Stars
- 5 Stars
Male/Female Interview % is simply the gender breakdown of the interview insights from this company. If you hover over the pie chart, you will see the % breakdown by gender.
The percentile score in the title is calculated across the entire Company Database and uses an adjusted score based on Bayesian Estimates (to account for companies that have less data).
Simply put, as a company gets more interviews, the confidence of a "true score" increases so it is pulled closer to the simple company average and away from the average of the entire data set.
The higher the percentile, the more likely this company is to interview a female based on our data.
- Male
- Female
The % of Interns Getting a Full Time Offer chart is meant to provide a realistic estimate of the hiring practices of the company based on the reviews at this company.
The number you see in the middle of the doughnut pie chart is the simple average of these scores. If you hover over the various sections of the doughnut, you will see the % breakdown of each score given.
The percentile score in the title is calculated across the entire Company Database and uses an adjusted score based on Bayesian Estimates (to account for companies that have few reviews). Simply put, as a company gets more reviews, the confidence of a "true score" increases so it is pulled closer to the simple company average and away from the average of the entire data set.
- 0%
- 10%
- 20%
- 30%
- 40%
- 50%
- 60%
- 70%
- 80%
- 90%
- 100%
The Interview Difficulty is a score ranging from very difficult (red) to very easy (green) generated based on the Interview Insights at this company.
The number you see in the middle of the doughnut pie chart is the simple average of these scores. The higher the number, the more difficult the interviews on average. If you hover over the various sections of the doughnut, you will see the % breakdown of each score given.
The percentile score in the title is calculated across the entire Company Database and uses an adjusted score based on Bayesian Estimates (to account for companies that have few interview insights). Simply put, as a company gets more insights, the confidence of a "true score" increases so it is pulled closer to its simple average and away from the average of the entire data set.
- Very Easy
- Easy
- Average
- Difficult
- Very Difficult
The Military Friendly chart shows the % of interviewed candidates that were in a military program or involved in the military at some point. If you hover over the the pie chart, you will see the % breakdown of military and non-military candidates.
The percentile score in the title is calculated across the entire Company Database and uses an adjusted score based on Bayesian Estimates (to account for companies that have less data).
Simply put, as a company gets more interviews, the confidence of a "true score" increases so it is pulled closer to the simple company average and away from the average of the entire data set.
The higher the percentile, the more likely this company is to grant an interview to someone with a military background.
- Yes
- No
The Interview Diversity chart is a way to estimate the opportunities being provided across races based on the Interview Insights at this company. If you hover over the various sections of the chart, you will see the % breakdown of each race based on our data.
- African American
- Alaska Native
- American Indian
- Asian
- Hispanic/Latino
- Native Hawaiian
- White
- Other
The Sports Matters? chart shows the % of interviewed candidates that played a varsity sport in their undergraduate university. If you hover over the the pie chart, you will see the % breakdown by Varsity Athletes and Non-varsity athletes. The percentile score in the title is calculated across the entire Company Database and uses an adjusted score based on Bayesian Estimates (to account for companies that have less data).
Simply put, as a company gets more interviews, the confidence of a "true score" increases so it is pulled closer to the simple company average and away from the average of the entire data set.
The higher the percentile, the more likely this company is to grant an interview to a varsity athlete based on our data.
- Yes
- No
Top Undergrad Schools represents the schools that are most targeted by the Company based on our data. The %s shown next to the school name are ONLY relative to the other top schools listed. These %s are provided solely to give you an idea of relative preference of each top school, not all schools.
- Columbia University30%
- Fordham University30%
- New York University NYU20%
- Rutgers University20%
Top Undergrad Majors represents the majors that are most targeted by the Company based on our data. The %s shown next to the major labels are ONLY relative to the other top majors listed. These %s are provided solely to give you an idea of relative preference of each top major, not all majors.
- Finance62%
- Economics31%
- Philosophy7%
Top Undergrad Degrees represents the degrees that are most targeted by the Company based on our data. The %s shown next to the degree labels are ONLY relative the other top degrees listed. These %s are provided solely to give you an idea of relative preference of each top degree, not all degrees.
- AB or BA58%
- BS or BSc or SB19%
- BBA16%
- MS or MSc6%
Company Details
Moody's is an essential component of the Global Capital Markets, providing credit ratings, research, tools and analysis that contribute to transparent and integrated financial markets. Moody's Corporation (NYSE: MCO) is the parent company of Moody's Investors Service, which provides credit ratings and research covering debt instruments and securities, and Moody's Analytics, which offers leading-edge software, advisory services and research for credit analysis, economic research and financial risk management. The Corporation, which reported revenue of $2 billion in 2010, employs approximately 4,700 people worldwide and maintains a presence in 27 countries. Further information is available at www.moodys.com.
Locations
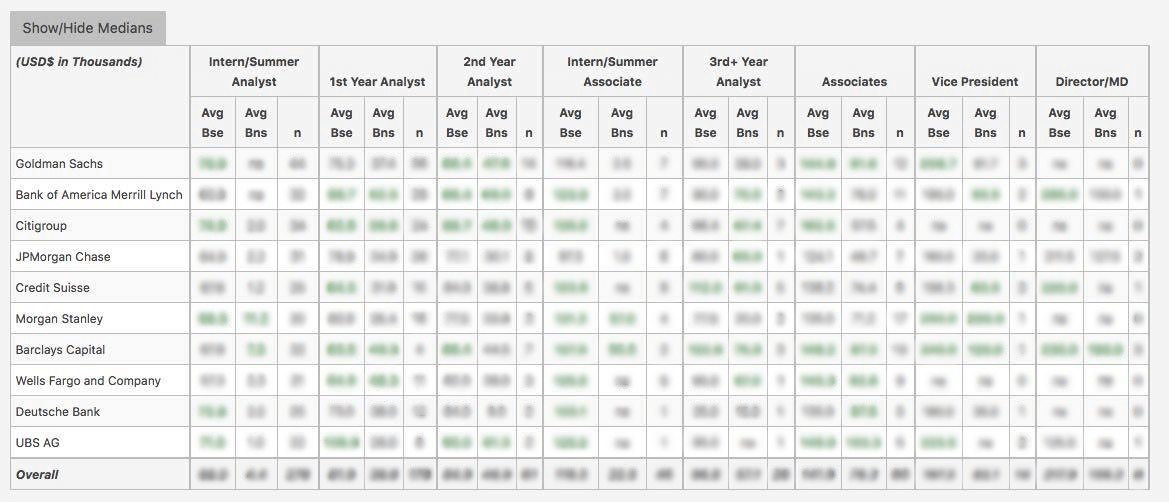
WSO Company Database Comparison Table
Moodys Corporation Interview Questions
or Want to Sign up with your social account?