STDEVPA Function
It returns the standard deviation of an entire population, given as function arguments


What Is the STDEVPA Function in Excel?
The STDEVPA function is one of the statistical functions in Excel. It returns the standard deviation of an entire population, given as function arguments. This function includes the logical values(TRUE and FALSE) and texts.
Statistically, the standard deviation of a distribution signifies the amount of variation or dispersion in the data set. A large standard deviation indicates that the data is widely spread, while a low value indicates that the data is closer to the distribution's mean.
In financial analysis, the STDEVPA function can help calculate the deviations in revenue. This is often used in portfolio management to assess and analyze the portfolio’s risk level.
The formula for the STDEVPA function in Excel is as follows:
=STDEVPA(value1, value2,.....)
Note
The terms in parentheses are called the arguments required by the function. These are the values that the function requires to do the calculations and produce the desired result.
This function takes the different samples of the population as its arguments. Here:
- Value1: It is a required argument. It represents the numeric argument corresponding to the first sample in the given population.
- Value2: It is an optional argument. It represents the numeric argument corresponding to the second sample in the population.
The number of arguments is equal to the number of samples given. In the above formula, value1 is a required argument, and value2 and all other arguments are optional.
Note
This function requires at least two numeric values in the arguments to calculate the desired results.
The arguments can be any of the following three:
- Numeric values lying between 1 and 255
- Arrays of values
- References to the cells containing numeric values
- The STDEVPA function is one of the statistical functions in Excel. It returns the standard deviation of an entire population, given as function arguments.
- The standard deviation of a distribution signifies the amount of variation or dispersion in the data set.
- The STDEVPA function calculates the standard deviation of an entire population. To calculate this quantity for a particular sample, we use the STDEVA function or the STDEV function.
- The STDEVPA function also allows logical values and texts in its arguments, while the STDEVP function ignores them.
- The STDEVA and the STDEVPA functions return approximately the same values for large sample sizes.
Understanding The STDEVPA function
The STDEVPA function ignores any empty cell in a cell reference or array provided as arguments.
The STDEVPA function computes the standard deviation of an entire population. To calculate the standard deviation of a particular population sample, we use the STDEVA function or the STDEV function.
The STDEVPA function also allows logical values(TRUE and FALSE) and texts in its arguments, along with numeric arguments. Like binary algebra, this function considers TRUE as 1(one) and FALSE as 0(zero) while computing the desired results.
Another function, the STDEVP function, also computes the standard deviation of the entire population. However, the STDEVP function does not consider any logical values or texts provided in the arguments.
Similarly, the STDEVA function allows logical values and texts in its arguments, but the STDEV function ignores them.
All these functions help to calculate the standard deviation only but with slight differences. Different functions are used for different use cases and scenarios we are working on.
The STDEVPA and STDEVP functions calculate the standard deviation of the entire population using the n method. The formula used by these functions to calculate the standard deviation of the population is as follows:
While the STDEVA and STDEV functions calculate the standard deviation of a particular sample of the population using the n-1 method, the formula used by these functions to perform the required computations for a particular sample in a population is as follows:

Here:
- x represents each value in the given dataset
- x1 represents the average(arithmetic mean) of the values in the dataset
- n refers to the number of values in the dataset
Examples of the STDEVPA Function in Excel
Having discussed all the theoretical concepts related to the STDEVPA function, let us now see some examples to understand the practical applications and usage.
Let us see example 1:
Suppose we have data on the monthly profit of a company(in million dollars) for the past three years, 2020, 2021, and 2022. The data looks as illustrated below:
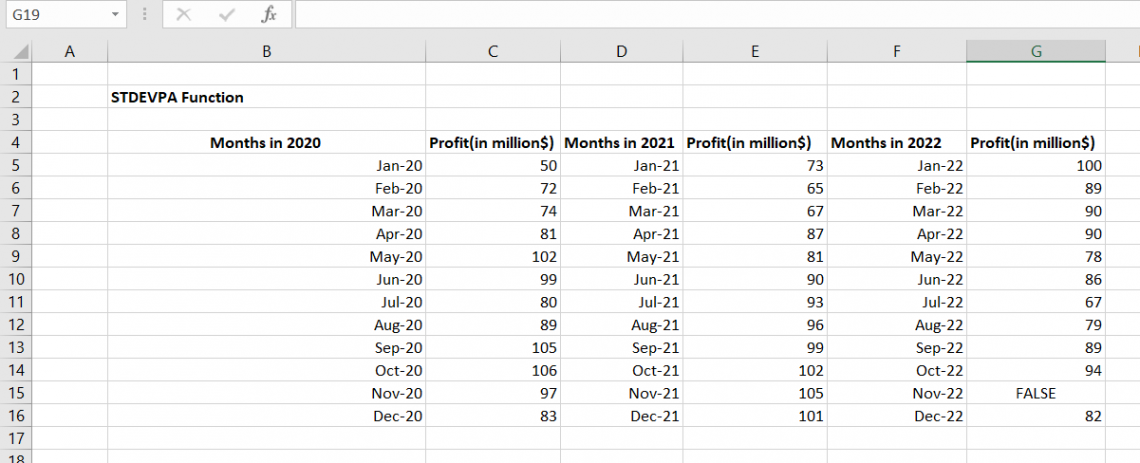
We have written FALSE in cell G15 as the profit in Nov-22, meaning that the company incurred a loss that month.
We wish to calculate the standard deviation of all three samples in the population. To do so, we use the STDEVPA function in Excel. The formula used for this is as follows:
=STDEVPA(C5:C16, E5:E16, G5:G16)

We have referenced the cells containing the profit values in the arguments. On using this formula in cell C18 of our Excel worksheet, we get the following result:
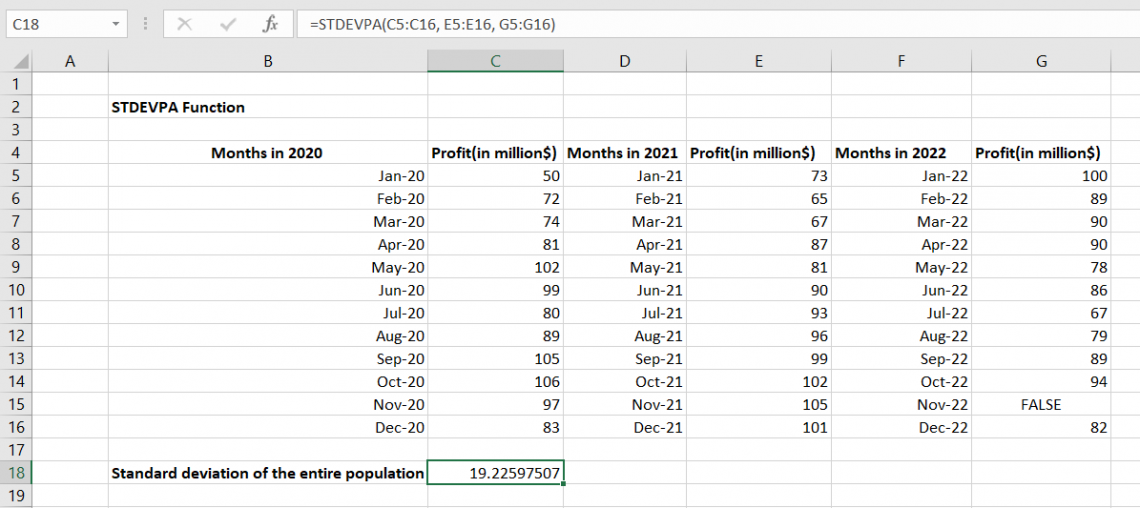
Hence, we get the standard deviation of the entire population as 19.22597507. In this way, we can use the STDEVPA function in Excel to calculate the standard deviation of the entire population.
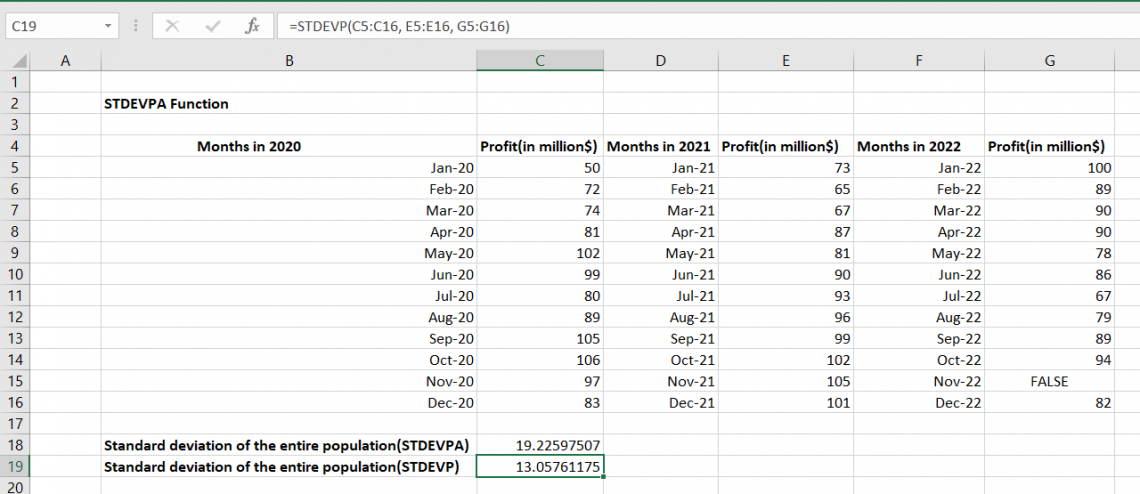
If we use the STDEVP function instead of the STDEVPA function, it will ignore the logical values and texts(here, FALSE in cell G15) while performing the calculations on the population. We get the following result on using the STDEVP function:
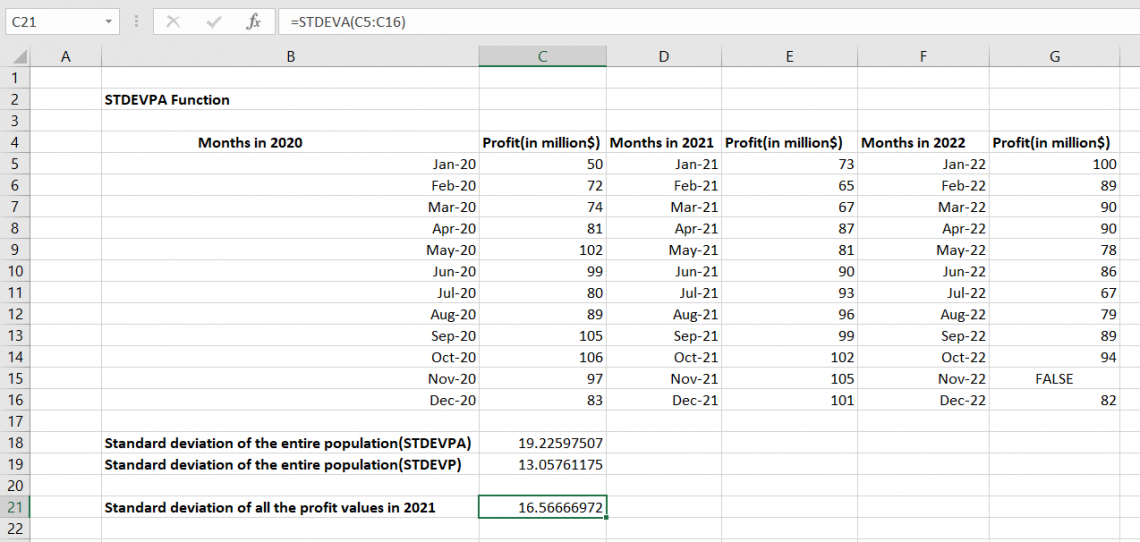
To calculate the standard deviation of a particular population sample, we use the STDEVA or the STDEV function. The difference between the two is that the STDEVA function includes logical values and texts in its arguments, while the STDEV function ignores them.
By default, the STDEVPA function assumes that the values mentioned in the arguments represent the entire population. Hence, if your data represents a particular sample of a population, you should use the STDEVA function to compute the standard deviation.
You might be thinking: what if the population has only one sample? Will the STDEVPA and STDEVA functions return the same value in that case? The answer is no because these functions use different formulas to compute the standard deviation.
So, even if there is only one sample in the population, the STDEVPA and STDEVA functions in Excel will return different values. Let us see example 2 to verify this claim:
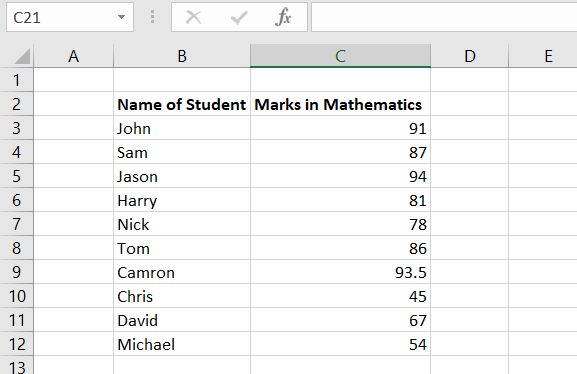
Suppose we have the data representing the marks of 10 students in Mathematics. The data looks as illustrated below:
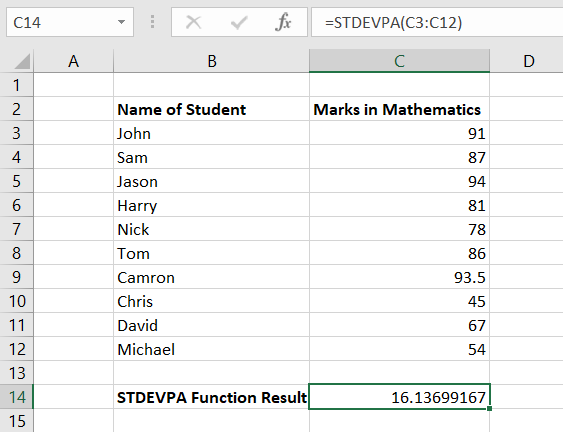
There is only one sample in this population. First, let us use the STDEVPA function to calculate the standard deviation of this one-sample population. We get the following result:
Now, using the STDEVA function to get the standard deviation of the given sample, we get the following result:
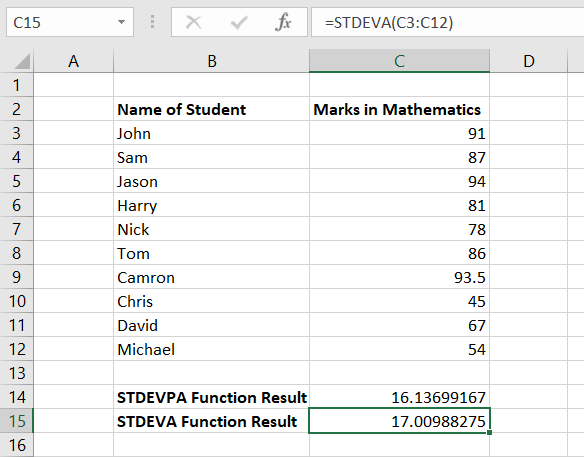
Hence, we get different values from the STDEVPA and STDEVA functions even if there is only one sample in the population.
In this way, you can calculate the standard deviation of the entire population or any sample of the population. You may choose the function that best suits your use case depending on whether you want to include or ignore the logical values and texts.
Points To Remember
Let's review the various STDEVPA function versions we saw in this article now that we have covered the use and implementation of this function in Excel extensively.

- The STDEVPA function calculates the standard deviation of the entire population given as arguments. It allows logical values(TRUE and FALSE) and texts in its arguments, along with the numeric arguments.
- It considers TRUE as 1(one) and FALSE as 0(zero), like binary algebra while performing the computations.
- The STDEVP function calculates the standard deviation of the entire population given as arguments, ignoring any logical value or text mentioned in the argument.
- The STDEVPA and STDEVP functions use the n method to calculate the standard deviation.
- The STDEVA function calculates the standard deviation of a particular sample in the population. It allows logical values and texts in its arguments, along with the numeric arguments.
- The STDEV function calculates the standard deviation of a particular sample in the population. It ignores any logical value or text mentioned in the argument. It only considers the numeric arguments.
- The STDEVA and STDEV functions use the n-1 method to calculate the standard deviation.


or Want to Sign up with your social account?