CHISQ.DIST Function
An Excel Statistical Function that helps users calculate the probability of the chi-square distribution.


What Is The CHISQ.DIST Function?
The CHISQ.DIST Function is an Excel Statistical Function that helps users calculate the probability of the chi-square distribution.
The Chi-Square is used in hypothetical testing when analyzing categorical data. The Chi-Square Test is a statistical test that Pearson formulated at the end of the 19th Century.
Before this, researchers assumed that observations followed a normal distribution and were indifferent to skewed distributions.
While considering biological comments, Pearson noticed the indifference and published several articles. As a result, we have Person distribution, which includes observations with both standard and skewed distribution.
Through the Pearson distribution, statistical analysis methods were developed, and various models were implemented to determine whether the statements fit into the model.
Popularly known as the Pearson Chi-square test, the test incorporates models to test whether the observations fit into a particular model or not. We will look at these models in detail to have more context.
Note
Normal Distribution is a distribution in which most of the statements fall into a similar range, and the absence of outliers results in a bell-shaped curve when plotted.
- The CHISQ.DIST function is an Excel Statistical Function that calculates the probability density function or the cumulative distribution function of the chi-square distribution.
- The syntax for the CHISQ.DIST function typically includes the following arguments: x (the value at which to evaluate the distribution), degrees_freedom (the number of degrees of freedom), and cumulative.
- The chi-square distribution is a probability distribution that is widely used in statistics, particularly in hypothesis testing and confidence interval estimation.
- The CHISQ.DIST function is commonly used in statistical analysis, hypothesis testing, and confidence interval estimation to calculate probabilities associated with the chi-square distribution.
Preliminaries of the Chi-Square Test
Before jumping directly into the concept of this test, let’s work on some of the required terms and their definitions.
Hypothesis testing
This involves setting up assumptions and testing whether our beliefs are applicable. The process goes like this.
- The users draw population parameters from the sample.
- Set assumptions on whether the population parameters comply with the sample.
- Null Hypothesis: An assumption that there is a relationship between population parameter and sample. Denoted as H0 and called H-naught.
- Alternative Hypothesis: An assumption alternates with the null hypothesis and assumes no relationship between the population parameter and the sample. It is denoted as H1 or Ha.
- After a series of tests based on the sample size, we will conclude whether the null or alternative hypothesis is true.
Let's take an example. The average age of the class is 30.
The Null hypothesis (H0) assumes the average age is 30, i.e., µ= 30, while the alternate theory assumes the average age is not 30, i.e., µ ≠ 30.
Categorical Variables
These variables are grouped based on some of their qualities or characteristics. These variables are fixed, i.e., they include only limited values of the same category.
There are two types of categorical variables:
- Nominal categorical variables: These groups are not ranked or ordered. For example, take colors. There is no ranking that red is number 1 or blue is number 3. These are just grouped based on their properties.
- Ordinal categorical variables: These include the variables that are ranked. For example, while rating a film, 5 stars are for excellent, 4 are for good, 3 are for average, 2 are for evil, and 1 for very bad.
Note
A variable is anything that can be measured. It might be the quantity, number, or any characteristic.
What is the Chi-square Test?
This statistical procedure involves testing the hypothesis of different variables understanding the distribution they fit in, and concluding the type of distribution they fall into.
We can define this test mathematically as the difference between the observed and expected frequencies. By calculating the difference, we can also understand the relationship between categorical variables.
The test is carried out through independent observations, and the data is unstructured, raw, and drawn from the sample.
The test is applicable during hypothesis testing. This is because we know we will make assumptions through hypothesis testing and testing whether the assumptions are correct.
This test will tell us about the difference between the expected and actual frequencies and outline the inconsistencies hidden in the data by considering the variables and the frequencies given.
We will also have Degrees of Freedom, which measures the variation in the observations. In this particular test, the degrees of freedom ascertain whether to accept or reject a null hypothesis.
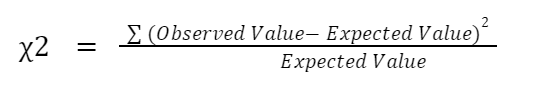
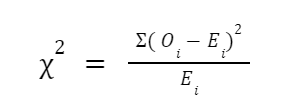
The formula is as follows.
Or
The following assumptions framed this test:
- The data(population) should be from a random sample to be analyzed, and decisions should be taken.
- The population's variables should be independent, which implies that each variable should contribute to one and only one category. For example, Employee ID should be of the numeric variety only.
- This test is not applicable when the expected frequencies are minor. Therefore, we have two solutions if the expected frequencies are negligible ( if values are less than 5).
- One is to combine the categories if possible, and
- The other is to get more data which will increase the sample size.
Types Of Chi-Square Tests
Now that we have the test's definition and formula, we will examine the types of tests in the section below.
Two types of chi-square tests are
- The goodness of fit
- Test of Independence
The goodness of Fit or Test of Homogeneity
The goodness of fit is designed to determine whether the variables or observations fit the distribution. To arrive at a good decision, our focus will be on the data. If the data have irrelevant variables, then the outcomes interpreted will also be irrelevant.
As said earlier, the goodness of fit considers all the count values of categorical variables and checks whether the variables involved represent the whole population of the simple random sample.
The interpretation of the outcome goes like this.
- If the goodness of fit results are high, the expected values follow the same pattern as the observed or actual values.
- If the goodness of fit results are low, the expected values move far from observed or actual values.
The features of the goodness fit model are as follows.
- The data should be a population from a simple random sample.
- Takes into consideration the statistical models as distributions.
- And check whether the distribution fits the observations collected.
- This also involves hypothesis testing: Null and Alternate Hypothesis construction.
- A combined group should have a minimum of 5 words to eliminate wrong decisions.
- The calculation process (formula) is the same as a chi-square test which is discussed further below.
Let us illustrate the goodness fit model.
Suppose the statement goes like this: The three sections, A, B, and C, of a course have identical numbers of students. The condition to be satisfied is to see whether all three areas have equal students. We have to test if all three teams have equal proportions of students.
Test of Dependence
Also known as the association test, this test is designed to know the relationship between two categorical variables.
- If the association between the categorical variables is positive, we can say there is no significant relationship between actual and expected observations.
- If the association between the categorical variables is negative, we can say there is a significant relationship between actual and expected observations.
The features of the test of dependence are as follows.
- The data should be a population from a simple random sample.
- Takes into consideration the statistical models as distributions.
- Check whether categorical variables are related or not.
- The data is constructed into a contingency table for better organization.
- Hypothesis testing - Null Hypothesis: Two categorical variables are unrelated.
- Alternate Hypothesis: Two categorical variables are considered to be related.
- A combined group should have a minimum of 5 observations.
Let us illustrate the test of dependence.
We are provided with student data with variables such as the Roll Number, Name, the number of hours spent on a subject, marks obtained, and so on. We must calculate the relationship between the number of hours spent on a topic and the marks obtained.
So our approach will take the variables of the number of hours spent and marks obtained and apply the formula.
How do you calculate Chi-square?
Let us examine the data prerequisites before applying the formula to calculate the test. Then, in the following steps, we will understand the process of making a decision using the test.
Summary of the steps included in the calculation:
- The assumptions of the variables or categories, i.e., the hypothesis, assume a Null or Alternate Hypothesis even before collecting the data.
- While performing the test, we will mostly assume the hypotheses as Null( there is no relationship between the two datasets).
- Set up the alpha value(∝) called the level of significance, which refers to the amount of uncertainty associated with the data. All the records and fields may not be of correct values. So, it is inevitable, and most of the time, we assume ∝ as 5 percent, i.e., ∝=0.05.
- Ensure that the data collected is free of errors and null values to make better decisions.
- Once again, look at the assumptions made and adjust them if assumed wrong.
- We will have the data with the actual and expected frequencies mentioned and all other information required to execute the formula stated above.
- Application of formula and arriving at the results. The result will be the probability of the independent variables.
- If the arrived value is less than the table value, then reject the null hypothesis and accept the alternate hypothesis and vice versa.
Chi-Square Example
Let us have an example to have more context.
We want to know whether there is any relationship between Education and political preference. We will have a population of 500 observations drawn from a simple random sample. The data is shown as follows.
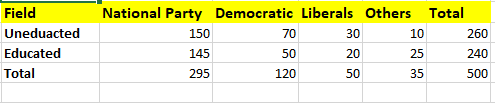
Perform a chi-square test to determine whether there is any relation.
1. Construct a Hypothesis.
- Null Hypothesis (H0): There is no relationship between Education and political party preference.
- Alternative Hypothesis (H1): There is a relationship between Education and political party preference.
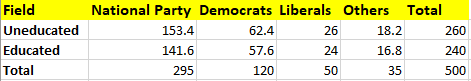
2. Calculate Expected Frequencies
Since we will be provided with the actual frequencies, we should calculate the expected frequencies.
The formula to calculate expected frequencies is as follows.

The Expected Frequency of an uneducated national party voter will be
(260*295 / 500) = 153.4
So, all the other values of the table will be as follows.
3. Apply the formula
We already discussed the formula for arriving at the desired value, and we will apply that formula now.
The formula is
(O - E)2 / E
O represents actual frequencies, and E represents Expected Frequencies.
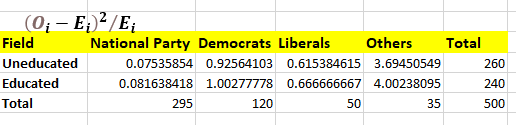
4. Calculate the Chi-square
We will arrive at the chi-square value by adding all the values from the last table.
χ2 = 0.075 + 0.925 + 0.615 + 3.69 + 0.08 + 1.00 + 0.66 + 4.002
χ2 = 11.06
To interpret the result, we must look at the degrees of freedom. The degrees of freedom formula is (r-1)(c-1), i.e., the number of rows in a table minus one and the number of columns in a table minus one.
Here, we have 2 rows and 4 columns, so (2-1) (4-1) = 3.
We assume that the alpha value is 5%, i.e., 0.05.
To decide whether to accept or reject the null hypothesis, we have to take table values that are already available. We have to look at the table value where the degree of freedom is 3 and the alpha value is 0.05. From the table, the value is 7.815.
We can see that the test value is greater than the table value. Therefore, we can accept the null hypothesis since the table value is less than our calculated value.
So, we can say there is no relationship or association between Education and political party preference. The calculation process is the same in Excel.
5. P values in the Chi-square test
It is undeniable that p values and test outcomes have a common ground. Probability, in a statistical sense, implies the estimation of something that is going to happen, and the chi-square test is concerned with whether the data fit a model or not.
And also, in the calculation of the test, we will be estimating the expected frequencies. So, somehow the connection is present and will impact each other.
We can also interpret the test results using the p(probability) values. The value of p decides the interpretation of whether to accept the result or reject the result.
- If the value of p<=0.05, the hypothesis is rejected
- If the value of p>0.05, the hypothesis is accepted.
Limitations Of Chi-Square Excel
We will look at the limitations of this test.
- Sample Size: The test is sensitive to the sample size. If the sample size is small, the results will not be efficient in making decisions.The same is true if the sample size is very large. The unimportant variables may become important ones, which will again impact the decisions.
- Establishes Vague Relationships: We have already seen how the test of Independence is performed to understand the relationships between variables. However, we will not know whether there is a causal relationship between the variables.
- We will only know whether there is any association between variables. There is no information about the type of relationship. We need to conduct more studies and tests to understand the causal relationships between the variables.
- Table Values: To interpret this test, we need table values. If these readily available table values are not present, we will not be able to determine whether to accept the hypothesis.
CHISQ.DIST Function in Excel FAQs
- The test is used to determine whether a distribution fits the observations.
- It is also used to test whether there is any relationship between categorical variables.
- The test is used for Hypothesis testing.
- It is also used for representing a sample from the population.
- It is used for statistical analysis and decision-making.
If the resultant value is more than the table value, accept the null hypothesis and reject the alternative hypothesis. If the resultant value is less than the table value, reject the null hypothesis and accept the alternate hypothesis.
We have a mathematical formula to arrive at the desired value. The steps summary is:
- Formulate the Hypothesis
- Calculate the Expected frequencies(E) by multiplying the row total and column total and dividing the total value.
- Then, calculate (O - E)2 where O is observed or the actual frequency.
- Calculate (O - E)2/E.
- If the value is greater than the table value, accept the null hypothesis; if not, reject it.
It is a test to understand whether there is any association between categorical variables. The application procedure of the test of Independence is the same as the test. The outcome is whether there is any relationship or not.

Free Resources
To continue learning and advancing your career, check out these additional helpful WSO resources:


or Want to Sign up with your social account?