CHISQ.INV Function
A Statistical Function in Excel that returns the inverse of the left-tailed probability for the chi-square distribution.


What is CHISQ.INV Function in Excel?
The CHISQ.INV Function is a Statistical Function in Excel that returns the inverse of the left-tailed probability for the chi-square distribution.

In statistical terms, the chi-square distribution is the sum of squares of independent standard normal random variables. If k is the number of degrees of freedom of the distribution, it would have k square terms.
This distribution is a special form of the gamma distribution. It helps us in inferential statistics. The chi-square distribution also helps in hypothesis testing and constructing confidence intervals in statistical analysis.
While doing hypothesis testing for a chi-square distribution, we need a null hypothesis and an alternative hypothesis to verify the claims.
Suppose the alternative hypothesis claims that the correct value of the parameter specified in the null hypothesis is less than the assumptions made in the null hypothesis. In that case, it is called a left-tailed test.
The probability distribution function(pdf) of the chi-square distribution is as follows:

Here:
- x is the continuous random variable
- K is the number of degrees of freedom of the distribution
- Γ(k/2) is the gamma function.
In financial analysis, it helps us to find the variations in our assumptions made from the actual hypothesis.
Variance refers to the squared deviation of a data set from its mean, and the standard deviation is the measure of the variation or dispersion in the data set from its arithmetic mean.

Suppose there is a precision machine that produces balls for ball bearings. The diameter of the balls produced by the machine is precisely 100 micrometers(0.1mm). We assume that the machine would produce balls of this size at a large scale on average. But on an individual scale, there could be some variations.
These variations generally follow a normal distribution. The size of the balls produced would depend on many factors like the amount of raw material available, amount of heat supplied, water content, etc.
Due to these factors, the variance of the normal distribution would vary from machine to machine. Some machines could show a small range of variation, while others may have a more scattered distribution, indicating wide variance in the size of the balls.
We can model and analyze this variance of the machines using the CHISQ.INV function in Excel.
The formula of the CHISQ.INV function in Excel is as follows:
=CHISQ.INV(probability, deg_freedom)
The terms in parentheses are called the arguments of the function. These are the values that the function requires to perform the calculations. The arguments required by the CHISQ.INV functions are as follows:
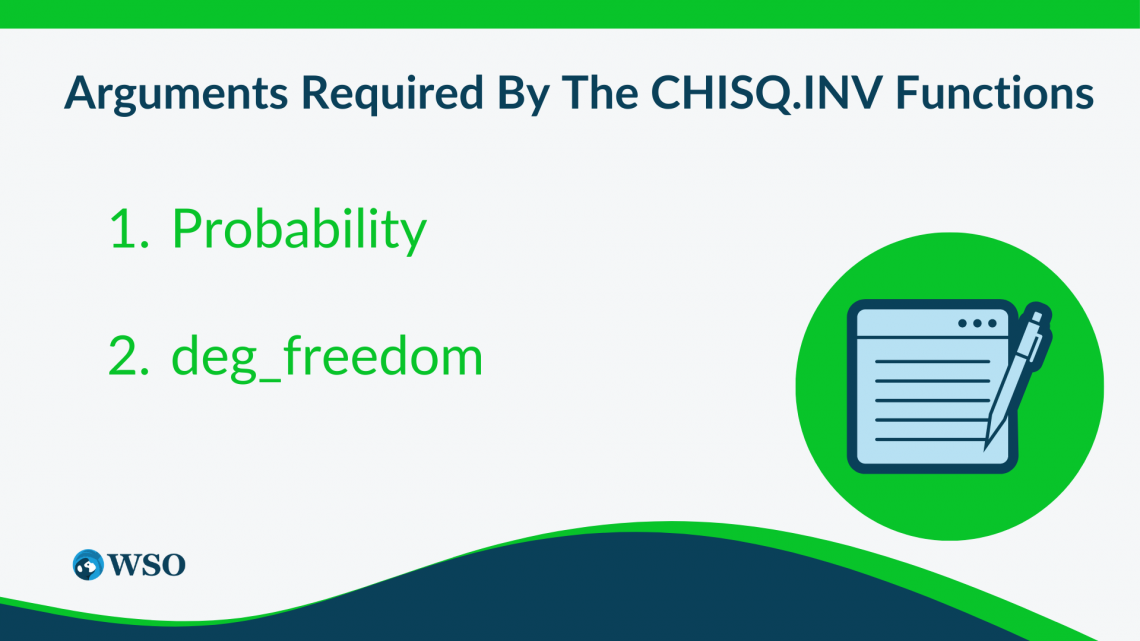
- Probability: This argument refers to the probability corresponding to the chi-square distribution. The probability of the distribution should lie between 0 and 1. If the probability value is less than 0 or more than 1, the function returns a #NUM! Error.
- deg_freedom: This argument refers to the number of degrees of freedom of the chi-square distribution. The degrees of freedom must be an integer lying between 1 and 10^10. If the degrees of freedom are less than 1 or more than 10^10, the function returns a #NUM! Error.

There are different categories of functions in Excel, like Financial Functions, Statistical Functions, Auditing Functions, etc. Which function to use depends on the use case and scenario we are working on.
The PMT, PPMT, and IPMT functions are popular financial functions in Excel, while the NORMINV and NORM.S.INV functions are statistical functions in Excel. In this article, we will also discuss the CHISQ.INV function in Excel.
- The CHISQ.INV function is an Excel Statistical Function that is used to calculate the inverse of the chi-square cumulative distribution
- The CHISQ.INV function is used to find the value x such that the chi-square cumulative distribution function equals a specified probability.
- The CHISQ.INV function requires the probability corresponding to the chi-square distribution and the number of degrees of freedom of the distribution to perform the calculations.
- The CHISQ.INV function may return an error if the specified probability is outside the valid range (typically between 0 and 1) or if the degree of freedom is not a positive integer. In such cases, it may return a #NUM! or #VALUE! error indicating the nature of the problem.
Examples of the CHISQ.INV Function in Excel
We have seen all the theoretical concepts and their formulas in Excel. Now, let us see a few examples to appreciate the practical applications of this function.

Let us see example 1:
Suppose we have a hypothetical chi-squared distribution with 18 degrees of freedom and a probability matching the distribution of 0.68. The information appears as seen below:
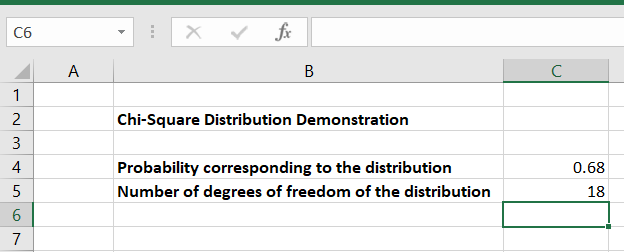
As shown above, in the Excel sheet, cell C4 shows the probability corresponding to the distribution, and cell C5 shows the number of degrees of freedom.
Using the CHISQ.INV function, the following formula is used to get the value of the probability distribution function (pdf) of the chi-square distribution for a probability of 0.68 and 18 degrees of freedom.
=CHISQ.INV(C4, C5)
On writing the above formula in cell C7, we get the desired result as shown below:
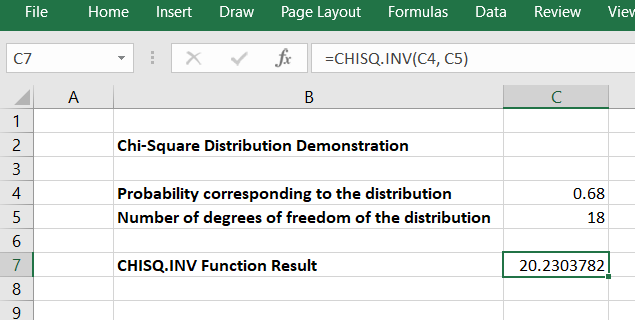
Hence, we get the function's value as 20.2303782 for the Chi-Square Distribution with a probability of 0.68 and 18 degrees of freedom.
In this way, we can calculate the inverse of the left-tailed probability for any Chi-Square Distribution with known probability and degrees of freedom using the CHISQ.INV function in Excel.
CHISQ.INV vs. NORMINV Function
Both the CHISQ.INV and the NORMINV function are statistical functions in Excel used for statistical analysis and data hypothesis testing.

The NORMINV function returns the inverse of the cumulative normal distribution for a particular mean and standard deviation. While the CHISQ.INV function returns the inverse of the left-tailed probability of the chi-square distribution whose probability and number of degrees of freedom are known.
Hence, the NORMINV function takes a normal distribution's probability, mean, and standard deviation as arguments to perform the calculations. The formula to calculate the inverse of the cumulative normal distribution using the NORMINV function in Excel is as follows:
=NORMINV((probability, mean, standard_dev)
The CHISQ.INV function takes the probability corresponding to the distribution and the number of degrees of freedom of the chi-square distribution as arguments to perform the desired calculations.
The formula to calculate the inverse of the left-tailed probability of the chi-square distribution using the CHISQ.INV function in Excel is as follows:
=CHISQ.INV(probability, deg_freedom)
The normal and chi-square distributions have different probability density functions(pdf). The probability density function of a normal distribution for a continuous random variable x is as follows:

Here:
- x is the continuous random variable
- µ is the mean of the normal distribution
- σ is the standard deviation of the distribution
The probability density function for the chi-square distribution for a continuous random variable x with k degrees of freedom is as follows:

Here:
- x is the continuous random variable
- k is the number of degrees of freedom of the distribution
- Γ(k/2) denotes the gamma function
These were the differences between the CHISQ.INV and the NORMINV functions in Excel. Both are statistical functions in Excel and which function to use depends on the use case and scenario we are working on.

Free Resources
To continue learning and advancing your career, check out these additional helpful WSO resources:


or Want to Sign up with your social account?