NORM.S.INV Function
An Excel Statistical Function that calculates the inverse normal cumulative distribution for any given probability.


What Is The NORM.S.INV Function?
NORM.S.INV function is an Excel Statistical Function that calculates the inverse normal cumulative distribution for any given probability.
However, we sometimes require Statistical functions in Excel when dealing with a probability distribution and its statistical implications. The need for a command depends on our use case and the data we are working with.
The normal distribution is a form of probability distribution in statistics that exhibits symmetry around the mean and demonstrates that data close to the distribution's arithmetic mean occur more frequently than data far from the arithmetic mean.
Graphically, a normal distribution appears as a bell curve. It is a symmetrical distribution.
The normal distribution is also known as the Gaussian distribution. The normal distribution of any random variable x is a continuous function whose probability density function(pdf) is given by:

Here,
- x is the unknown data point or the random variable,
- µ is the mean of the distribution, and
- σ is the standard deviation of the distribution, which shows the variation or dispersion in the data set.
A high standard deviation refers to data that is more widely spread, while a low standard deviation refers to data that is closer to the distribution’s mean.
-
The NORM.S.INV function is an Excel Statistical Function used to calculate the inverse of the cumulative standard normal distribution for a given probability.
-
Users provide a probability value as the argument to the NORM.S.INV function. It returns the corresponding z-score, representing the number of standard deviations from the mean for a given probability.
-
NORM.S.INV function provides insights into the likelihood of observing a particular value in a standard normal distribution. It helps to assess the significance of the data portion to the distribution's mean and standard deviation.
-
Users might encounter potential errors when using the NORM.S.INV function, such as providing probabilities outside the valid range (0 to 1) and how to address them effectively.
Understanding NORM.S.INV Function in Excel
The inverse of a normal distribution is a reverse process of normal distribution, which calculates the value of the unknown data or the random variable from a known probability.
The probability density function is calculated for a given random variable x, with a known mean and standard deviation in a normal distribution.
Microsoft introduced the NORM.S.INV function in MS Excel 2010. It is an upgraded version of the NORMSINV function and falls under the financial functions category in Excel.
NOTE
In financial analysis, the NORM.S.INV function helps in stock market analysis. This function can help us understand how a portfolio is affected by any additions or withdrawals.
Let us take a practical example to understand and appreciate the use of the NORM.S.INV function in Excel.
- Suppose a factory manufactures washing machines. The factory owners want to investigate the failure times of the rotating parts of the washing machines to determine the appropriate warranty period.
- The failure time of the rotor of the washing machines follows a normal distribution, with a mean of 8,000 hours and a standard deviation of 200 hours.
- The plant processors can use the NORM.S.INV function to find the time by which 10% of the rotors fail, the times between which 90% of all the rotors fail, and the time at which only 10% of the rotors are functioning.
- Assuming the data set of the times of failure of the rotors follows a normal distribution, with a mean of 8,000 and a standard deviation of 200, the time by which 10% of the rotors of the machines would fail is the inverse cumulative distribution function of (10/100) or 0.10.
The formula or syntax of the NORM.S.INV function in Excel is as follows:
=NORM.S.INV(probability)
The NORM.S.INV function requires only one argument to compute. Here, the argument probability refers to the probability corresponding to the normal distribution. It signifies the value of the random variable at which one wants to obtain the inverse distribution.
For the probability distribution to be valid and realizable, the probability should always lie between 0 and 1. If the probability is less than 0 or more than 1, the NORM.S.INV function returns the #NUM! Error value.
Calculating the Inverse Normal Cumulative Distribution
Having seen the theoretical aspects and formula of the NORM.S.INV function, let's now see some examples to appreciate its applications in Excel.

Suppose the probability of a given data set is 0.84. Then, we intend to obtain the inverse of the standard normal cumulative distribution for the given probability.
To achieve this, we use the NORM.S.INV function in Excel. As seen earlier, this function requires only one argument to compute: the probability corresponding to the distribution.
Given the probability of the data set is 0.84, as illustrated below:
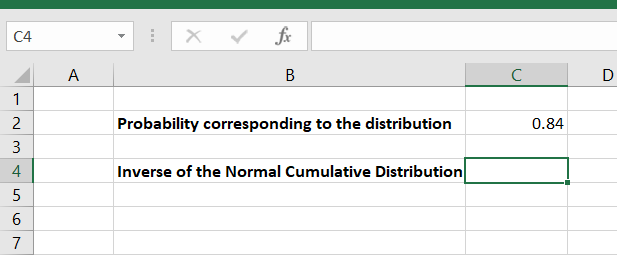
Cell C2 in the spreadsheet above shows the probability corresponding to the distribution. We need to calculate the inverse normal cumulative distribution for the above data. We can achieve this by using the following formula:
=NORM.S.INV(C2)
By applying the above formula, in cell C4, we get the desired result, the inverse of the normal cumulative distribution, as shown below:
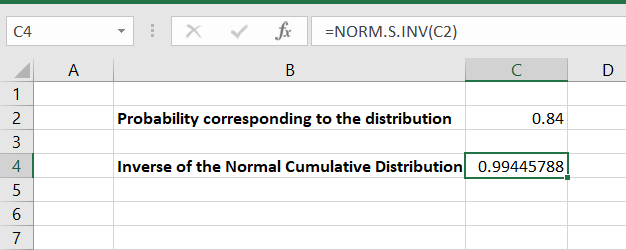
Hence, the inverse distribution for a probability of 0.84 is calculated as 0.99445788. Using the NORM.S.INV function in Excel, we can obtain the inverse of the cumulative normal distribution for any given probability.
NORM.S.INV vs. NORMINV Function in Excel
The NORM.S.INV and the NORMINV functions have been classified as statistical functions in Excel. This is because they are designed to work with data that follows a normal distribution.

Both these functions evaluate the inverse of the normal cumulative distribution. However, the distinction lies in the type of distribution they operate on. The NORM.S.INV function returns the inverse of a standard normal distribution, while the NORMINV function returns the inverse of a generalized normal distribution.
A standard normal distribution is a simplified form of the normal distribution function. For example, when the mean of the distribution comes to 0, and the standard deviation becomes 1, it is called a standard normal distribution.
The probability density function of a normal distribution is as follows:

Here,
- x is the unknown data point or the random variable,
- µ is the mean of the distribution, and
- σ is the standard deviation of the distribution, showing the variation or dispersion in the data set.
The probability density function for a standard normal distribution is obtained by setting the mean(µ) equal to 0 and the standard deviation(σ) equal to 1 in the formula above.
Hence, the standard normal distribution for a continuous random variable x is as follows:

So, the NORMINV function requires three arguments to do the computations. They are:
- The probability corresponding to the distribution
- The mean of the distribution
- The standard deviation of the distribution
On the other hand, the NORM.S.INV function requires only one argument to compute the probability corresponding to the distribution.
The formula for using the NORMINV function in Excel is as follows:
=NORMINV(probability, mean, standard_dev)
where the arguments have the same meanings as mentioned above.
The formula for using the NORM.S.INV function in Excel is as follows:
=NORM.S.INV(probability)
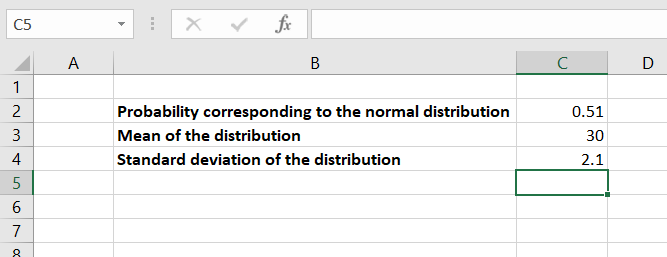
Let's consider an example to understand the difference between the two functions. Suppose we have a hypothetical normal distribution for a continuous random variable x. Then, the probability corresponding to the distribution is 0.51, the mean of the distribution is 30, and the standard deviation is 2.1.
The data looks as illustrated below:
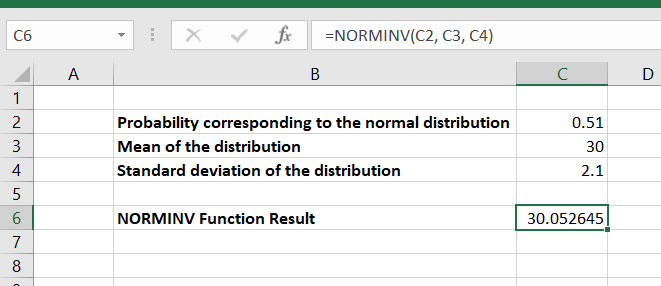
Using the NORMINV function, the following formula can be used to obtain the inverse of the normal distribution:
=NORMINV(C2, C3, C4)
By applying this formula, we obtain the following result in cell C6:
If the mean of the above distribution becomes 0 and the standard deviation comes to 1, it becomes a standard normal distribution.
To calculate the inverse of the cumulative normal distribution, using the NORM.S.INV function, we use the following formula:
=NORM.S.INV(C2)
By applying this formula in cell C7, we get the following result:
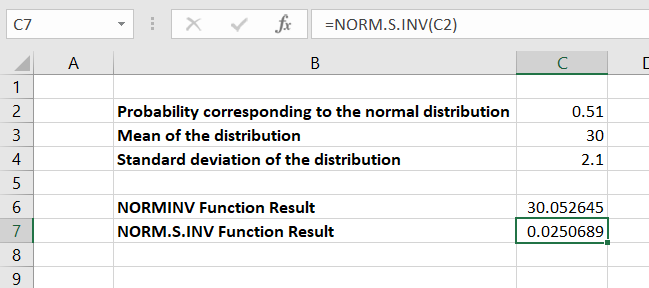
Hence, we can see that the inverse of the standard normal distribution, calculated by the NORM.S.INV function, is less when compared to the inverse of the normal distribution, calculated by the NORMINV function.

Free Resources
To continue learning and advancing your career, check out these additional helpful WSO resources:


or Want to Sign up with your social account?