LOGNORM.DIST Function
Returns the lognormal distribution of a given value x, where ln(x) is normally distributed and defined by parameters like mean and standard deviation.


What Is The LOGNORM.DIST Function?
The following article explains how to use Microsoft Excel to calculate the lognormal distribution of a dataset, including the distribution’s mean and standard deviation. Step-by-step instructions have been provided for using Excel's built-in functions, such as LN, LOGNORM.DIST, and LOGNORM.IN to perform the calculations.
The lognormal distribution function on excel returns the lognormal distribution of a given value x, where ln(x) is normally distributed and defined by parameters like mean and standard deviation. The function is used to analyze the data that has been logarithmically transformed.
But what exactly is a lognormal distribution?
- A lognormal distribution is a probability distribution of a random variable whose logarithm is normally distributed.
- In other words, if X has a lognormal distribution, Y = ln(X) has a normal distribution.

Where
- X = Value of the random variable
- μ = mean of the logarithm variable
- σ = Standard deviation of the logarithm of the variable
- π = Mathematical constant called Pi with a value of 3.141592…
- e = Mathematical constant called Euler’s number with an approximate value of 2.71828
The shape of a lognormal distribution is skewed to the right and is bounded by zero.
It can be used to create models with a minimum value of zero and no upper limits.
This is especially useful when creating models for stock prices, options, and income.

- Excel provides functions for calculating the lognormal distribution, useful in finance and statistics.
- Lognormal distribution is skewed to the right and bounded by zero, suitable for modeling various variables.
- Use LOGNORM.DIST in Excel to calculate probability density or cumulative distribution.
- Use LOGNORM.INV in Excel to find the inverse of the cumulative distribution.
- Lognormal distribution is applied in finance, biostatistics, geology, physics, and environmental sciences.
How to use the Lognormal Distribution Excel Function
Excel provides built-in functions for generating random numbers from a lognormal distribution and calculating the probability density function and cumulative distribution function of a lognormal distribution.
These functions can be useful for modeling skewed data in various applications.
1. LOGNORM.DIST(x, mean, standard_dev, cumulative)
You use the LOGNORM.DIST function in Excel to calculate the probability density function or cumulative distribution function of a lognormal distribution, given a set of parameters.
The function is often used in finance and statistics to model variables that follow a lognormal distribution, such as stock prices, interest rates, and commodity prices.
The parameters are as follows:
- X: The value at which to evaluate the function
- Mean: The mean of ln(x)
- Standard_dev: The standard deviation of ln(x)
- Cumulative: A logical value that determines the form of the function.
- If cumulative is TRUE, LOGNORM.DIST returns the cumulative distribution function;
- if FALSE, it returns the probability density function.
While using this excel function, it is important to remember a few things that may pose a problem in the results. They are as follows:
- Suppose any argument is non-numeric, the function =LOGNORM.DIST will not work and show the error #VALUE!
- If the mean (x) is less than or equal to zero or the standard deviation is less than or equal to zero, the function =LOGNORM.DIST will not work and show the error #NUM!
2. LOGNORM.INV(probability, mean, standard_dev)
LOGNORM.INV is a function in Microsoft Excel that returns the inverse of the cumulative distribution function (CDF) of the lognormal distribution, given a probability value.
The function returns the value X such that LOGNORM.DIST(x, mean, standard_dev, TRUE) equals the given probability. The probability is between 0 and 1, representing the random variable's cumulative probability.
Using this, you can generate random numbers from a lognormal distribution using the =LOGNORM.INV function returns the inverse of the cumulative distribution function for a lognormal distribution.
The parameters in the function are as follows;
- Probability: A probability associated with the lognormal distribution.
- Mean: The mean of ln(x)
- Standard_dev: The standard deviation of ln(x)
While using this excel function, it is important to remember a few things that may pose a problem in the results. They are as follows:
- If any argument is non-numeric, the function =LOGNORM.INV will not work and show the error #VALUE!
- If the probability is less than or equal to zero or if the probability is greater than or equal to one, the function =LOGNORM.INV will not work and show the error #NUM!
- If the standard deviation is less than or equal to zero, the function =LOGNORM.INV will not work and show the error #NUM!
Lognormal Distribution Function Example In Excel
Now that we have a general understanding of the lognormal distribution and its functions in Excel let’s start with an example to solidify this understanding further.

Below is the step-by-step guide to maneuver your way through excel using not just LOGNORM.DIST and LOGNORM.INV functions and other statistical tools, such as the STDEV, to calculate the standard deviation, which is crucial in the probability distribution.
The following can be done with any population and sample size, provided the parameters are numerical in nature, as discussed earlier. Otherwise, the function simply won’t work. However, after some practice, it becomes fairly intuitive.
The steps are as follows:
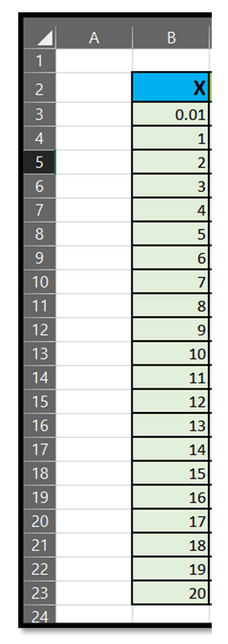
Step 1
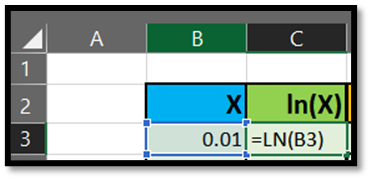
Let’s define our X values below. We can calculate the log of X or ln(X) by using a function provided in excel, which is =LN(X).
Step 2
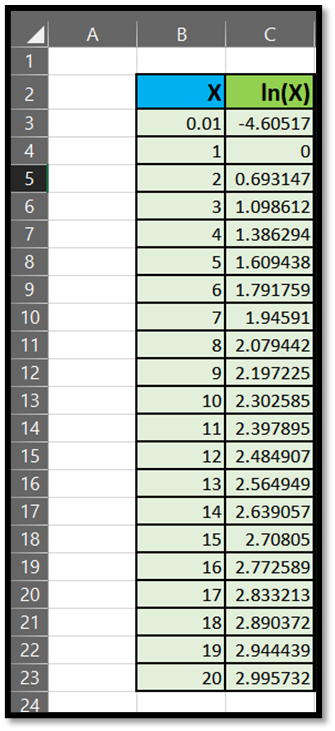
Then calculate the log of X or ln(X) by using a function provided in excel, which is =LN(X) as shown below:
By dragging the cell C3 with the LN formula, we can replicate the formula for all X values.
Step 3
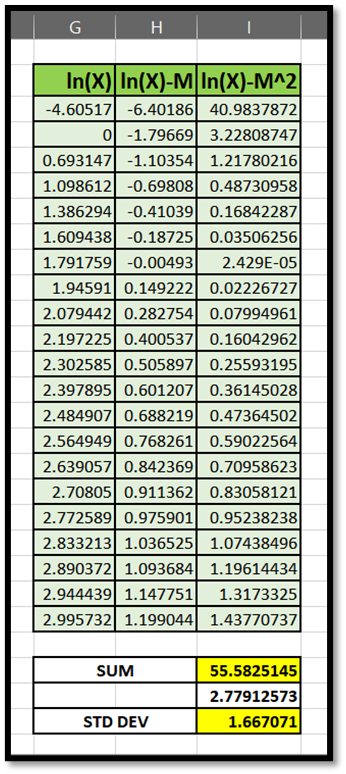
We must then calculate the sum, mean, and standard deviation of ln(X) as shown below
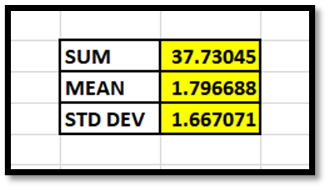
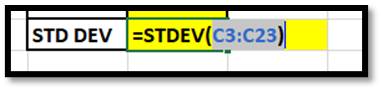
There is a shortcut to calculate the standard deviation, and that is by using the excel function =STDEV(range of the log of x)
If you want to calculate the standard deviation manually, that can also be done by using the following steps:
- First, subtract all the ln(x) values from the mean.
- Square the difference between the ln(x) values and the mean.
- Sum the squared differences.
- Divide the sum you calculated by N-1. We subtract 1 from N to account for the degree of freedom used for a sample's calculations. For a population, however, just use N.
- Take the square root of the divided figure, and you’ll arrive at your standard deviation.
Step 4
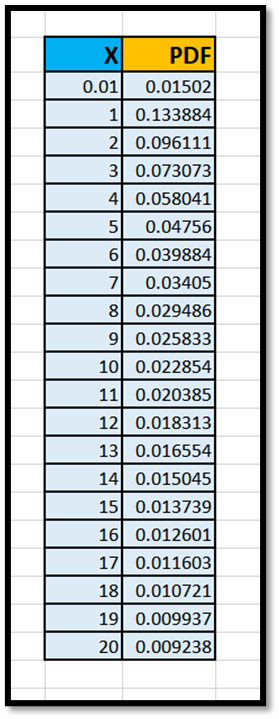
Calculate the PDF, and the excel function, as discussed previously, is
=LOGNORM.DIST(X, Mean, Standard_dev, Cumulative)
The cumulative is FALSE because we want the function to return a probability density function.
Step 5
By jointly selecting all the X and PDF figures, we can create a scatter plot that gives us a lognormal distribution. One of the properties of the lognormal distribution is that it is bounded by zero and is positively skewed to the right, as evident from the diagram below.
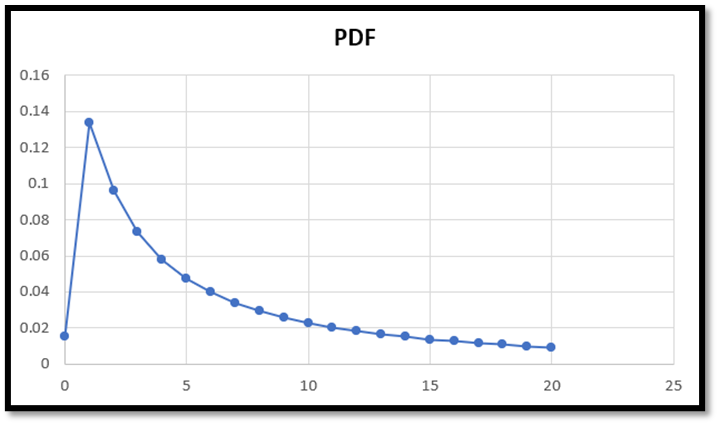
We have our X values on the horizontal X axis; on the vertical Y axis, we have our probabilities.
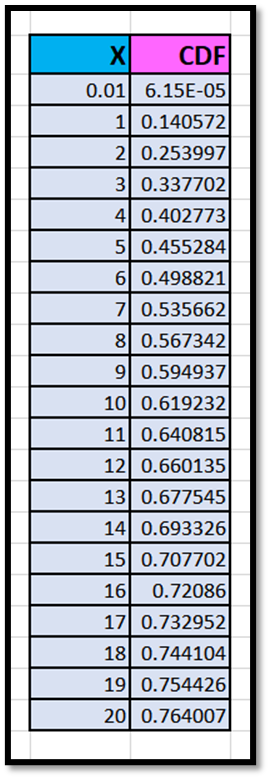
Step 6
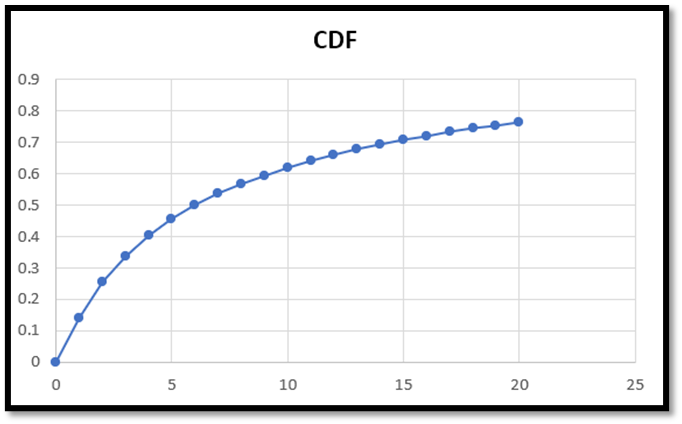
We can also calculate the Cumulative Distribution Function (CDF) by using TRUE as our cumulative in the lognormal distribution function and keeping all else the same.
Step 7
We can create a scatter plot showing us the Cumulative Distribution Function by selecting all the X and CDF figures.
Uses of Lognormal Distribution
Lognormal distribution has numerous applications in various fields, including finance, physics, and biology. It is a useful statistical tool for analyzing and modeling data with positive skewness and no lower bound.
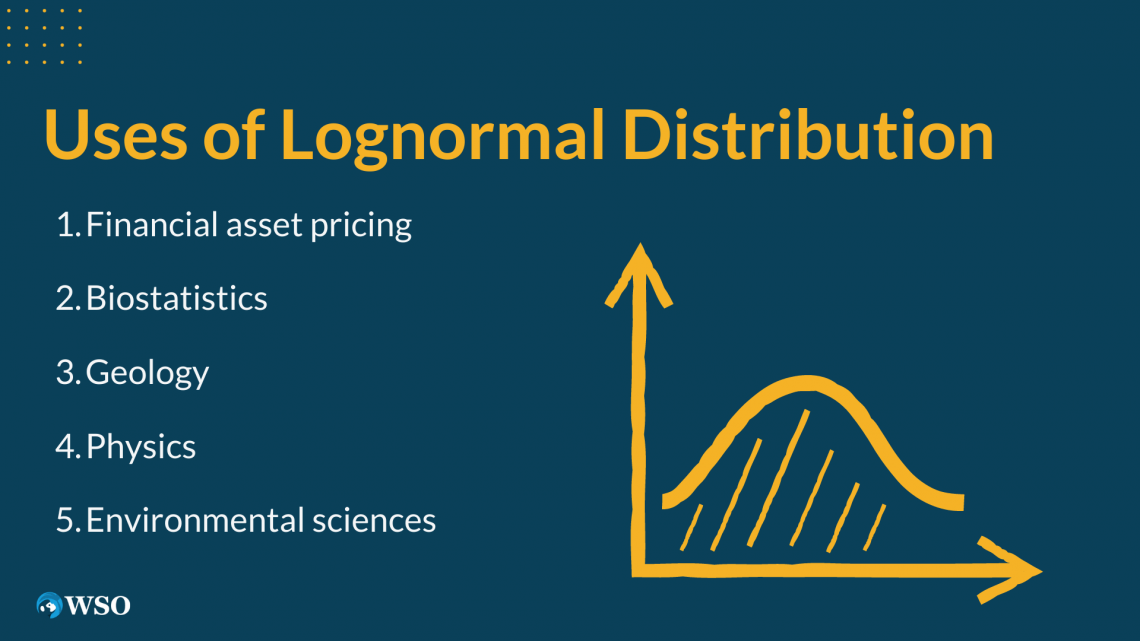
Below are some of the most common applications of the lognormal distribution:
1. Financial asset pricing
- Stock prices and option prices are frequently modeled using the lognormal distribution.
- This is because the distribution is well suited for modeling those figures which are always positive, such as stock prices and interest rates.
2. Biostatistics
- The lognormal distribution can be used in Biology as well. It is used to simulate biological scenarios and the probabilities of those scenarios.
- For example, if a patient has a tumor, lognormal distribution can help assess the rate of change in the tumor size.
3. Geology
Lognormal distribution can be used for modeling the mineral deposits with other well-explored regions with similar geological characteristics.
NOTE
Log-normal distribution cannot be used to model the distribution of minerals when multiple deposit types and geological characteristics exist.
4. Physics
The log-normal distribution can describe how small particles in the air are distributed in size. This is because the size of these particles is influenced by various factors, such as
- how fast they are formed,
- how much they grow, and
- how they stick together.
5. Environmental Sciences
The log-normal distribution can also be used to predict the frequency and intensity of rainfall, as rainfall data is usually skewed to the right.
The reason for the skew is that most of the rainfall historically has been due to a few large events. This makes using normal distribution difficult because normal distribution assumes equal probabilities.
In general, the log-normal distribution is useful in any situation where the variable of interest is the product of many small, independent factors or where the variable is skewed to the right, constrained to be positive.
LOGNORM.DIST Function FAQs

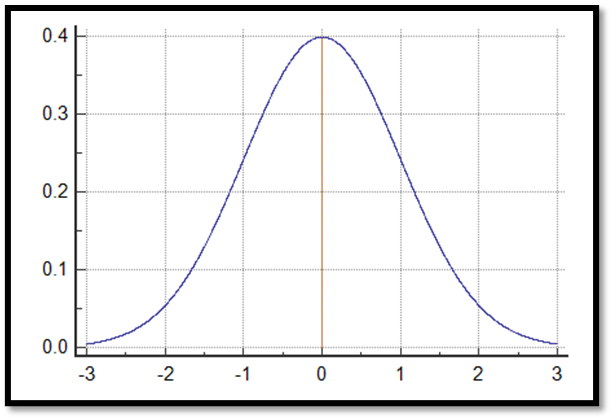
The normal distribution and the log-normal distribution are two probability distributions with different shapes and properties.
The normal distribution is a symmetrical, unimodal bell-shaped curve. It is defined by two parameters: mean and standard deviation. The normal distribution is used to model data symmetrically distributed around a central value, such as population heights and weights.
Your model’s average return is exactly in the middle of the distribution, and you are equally likely to have a return on either side of the distribution.
In contrast, the log-normal distribution is a probability distribution of a random variable whose logarithm is normally distributed. It has a positive skew and is defined by the mean of the variable's logarithm () and the standard deviation of the variable's logarithm ().
The log-normal distribution is applied for modeling data that is positively skewed and concentrated on the low end of the scale, such as income, stock prices, or the size of particles in a sample.
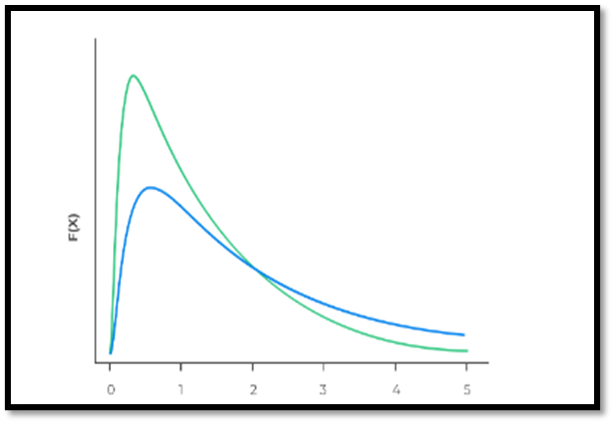
In conclusion, the main distinction between the normal and log-normal distributions is that the former is symmetric and unimodal, whereas the latter is positively skewed.
The normal distribution is characterized by the mean and standard deviation, while the log-normal distribution is characterized by the mean and standard deviation of the logarithm of the variable.
To generate a random number that is lognormally distributed, the excel function below can be used.
=LOGNORM.INV(RAND(), Mean, Standard_dev)
The RAND() function generates a random number between 0 and 1, which is used as the probability input to the LOGNORM.INV function to generate a random number with lognormality.
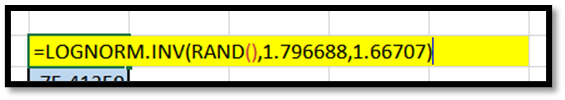
In this case, we’ve taken the mean and the standard deviation from the calculation in the example. Using this function, excel generates random numbers with a mean and standard deviation of any number we define, which is lognormally distributed.
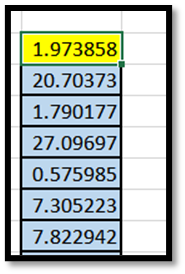
You can copy this formula and drag it to as many cells as you wish. By pressing F9, excel will recalculate the function with a different probability causing the values to change. The results would still be lognormally distributed.


or Want to Sign up with your social account?