Positively Skewed Distribution
A type of distribution in which most values are clustered around the left tail of the distribution


A positively skewed distribution, also known as a right-skewed distribution, is when values are gathered on the right-side of the mean of the distribution.
Positive skewness has important implications on the mean, median, and mode of the data. In finance, a positively skewed distribution means there will likely be frequent small losses and few large gains.
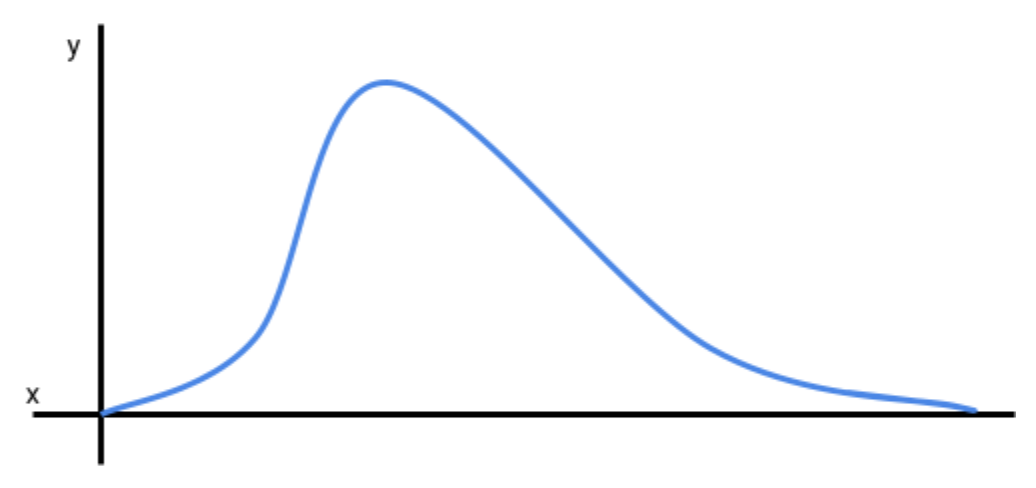
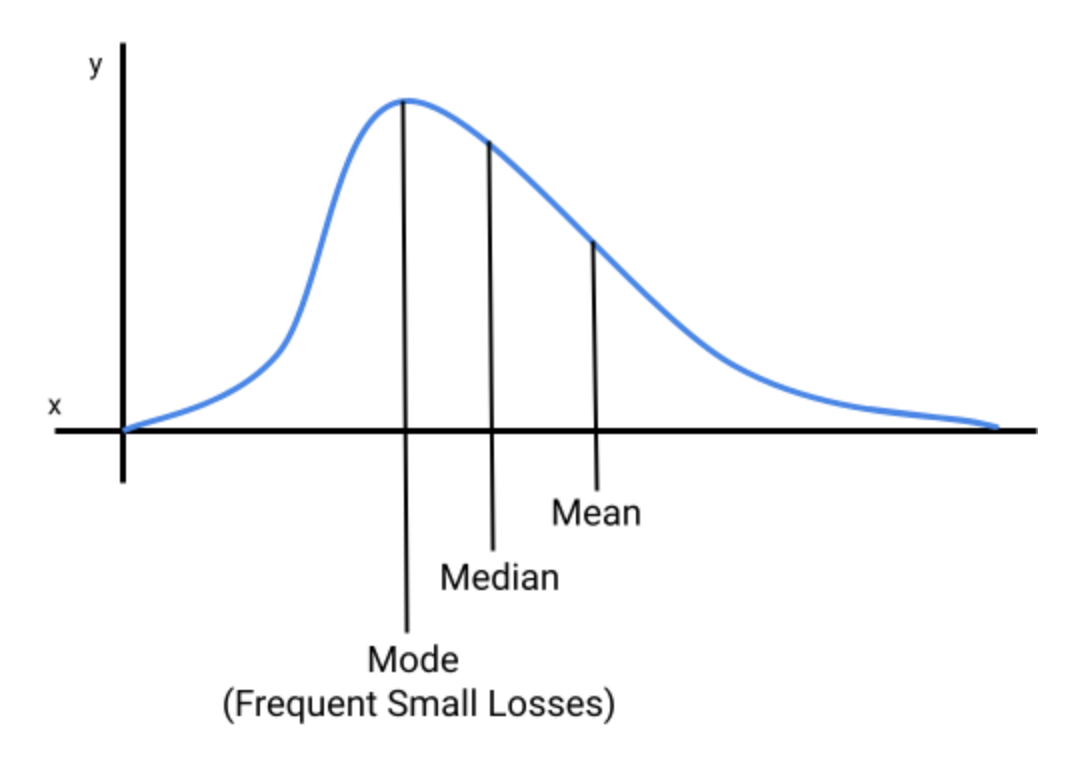
Below is what a positively skewed distribution might look like. The right-tail is longer in a positively skewed distribution. In other words, the distribution is being pulled to the right.
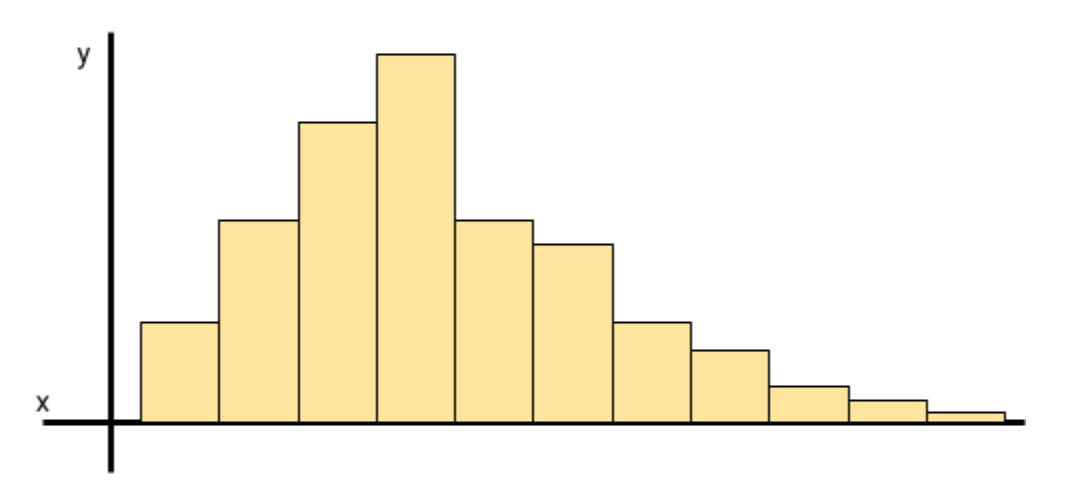
It is important to remember that a distribution may be presented in other formats, such as a bar chart or histogram. The bar chart below is also a positively skewed distribution.
Positively Skewed Distributions: Measures of Central Tendency
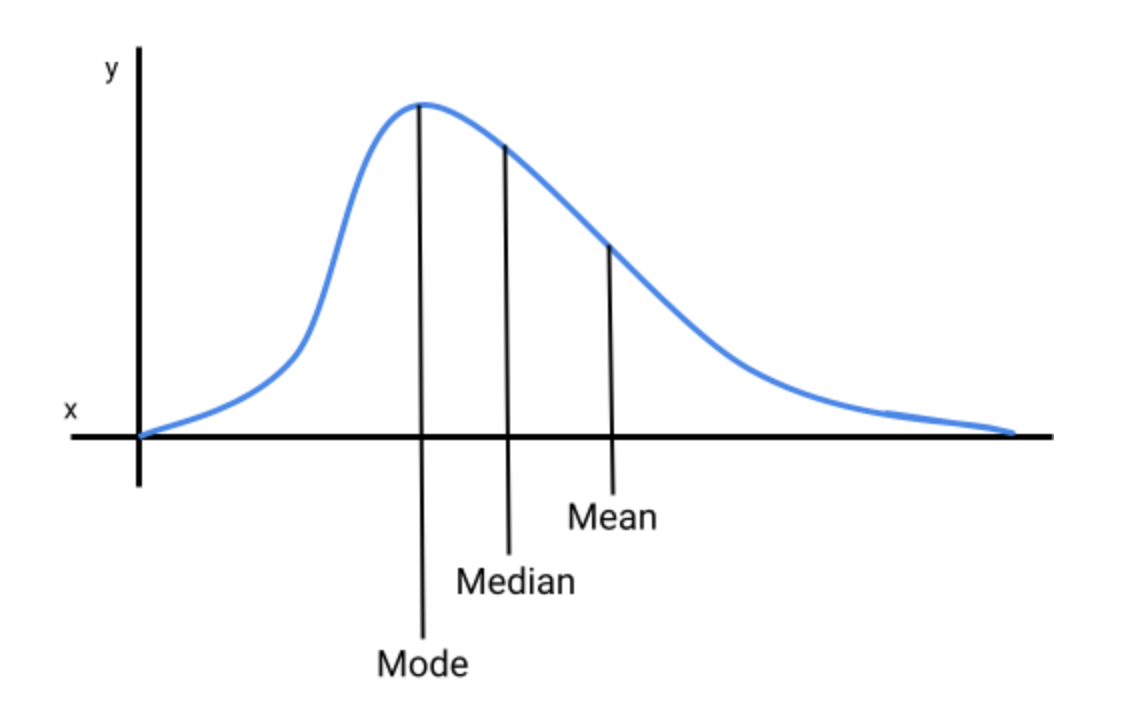
Measures of central tendency, in statistics, refers to the data points in the middle of a normal distribution. In a normal distribution the mean, median, and mode are all equal to each other.
For example, if the mean in a normal distribution is 3, then the median and mode will also be 3.
If the distribution is skewed to the right, a positively skewed distribution, or skewed to the left, a negatively skewed distribution, then the mean, median, and mode will not be equal.
In a positively skewed distribution the mean is greater than the median, which is greater than the mode (mean > median > mode). The following image illustrates this better.
The table below presents the central tendency for each distribution.
| Distribution | Measures of Central Tendency |
|---|---|
| Positively Skewed Distribution | Mean > Median > Mode |
| Negatively Skewed Distribution | Mean < Median < Mode |
| Normal Distribution | Mean = Median = Mode |
Below is a table with definitions for mean, median, and mode.
| Measures of Central Tendency | Definition |
|---|---|
| Mean | The average of the data points. Sum of all values divided by the number of values. |
| Median | The middle point of the data set (data must be sorted in ascending or descending order). |
| Mode | Datapoint that appears the most in a data set. For instance, if 3 appears more times than any other number, then 3 is the mode. |
Positively Skewed Distributions: What Does It Tell Us?
In investing or finance, a positively skewed distribution tells us that an investment or portfolio is expected to experience frequent small losses and few large gains. In a negatively skewed distribution an investment is expected to experience frequent small gains and a few large losses. A positively skewed distribution is often more desirable than a negatively skewed distribution since the amount of the large gains will, hopefully, cancel out the amounts of the small losses.
In the graph below, the distribution is being pulled to the right, which means the mean return will be larger than the median and mode of the return series. The mode will be the return that an investor will experience more frequently, which will be frequent small losses. Infrequent large gains will be clustered on the extreme part of the right tail, which is pulling the distribution away from its center.
Example of A Positively Skewed Distribution
Let’s assume that a portfolio manager wants to see the annual distribution of an investment over the past year (in the United States there are typically 253 trading days in a year). The portfolio manager proceeds to gather the annual returns and the frequency of their occurrence. The returns and the return frequency are provided in the table below.
| Returns (USD) | Frequency (Days) |
|---|---|
| -700 | 1 |
| -600 | 5 |
| -500 | 15 |
| -400 | 30 |
| -300 | 34 |
| -200 | 30 |
| -150 | 19 |
| -100 | 17 |
| 0 | 16 |
| 100 | 15 |
| 200 | 14 |
| 300 | 13 |
| 400 | 12 |
| 500 | 11 |
| 1,000 | 9 |
| 3,000 | 8 |
| 5,000 | 4 |
The portfolio manager then plots the returns and their frequencies on a graph. The vertical axis (y-axis) is the frequency (number of days), and the horizontal axis (x-axis) is the dollar amount of each return.
Below is a graph of the return distribution.
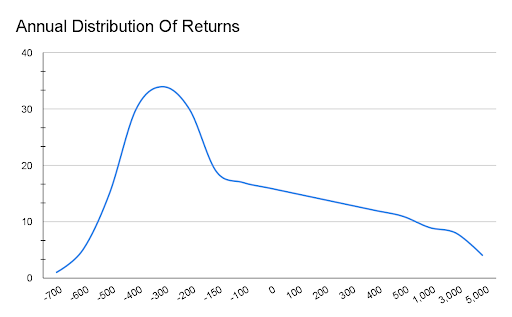
When analyzing the return series, the manager notices that the distribution is being pulled to the right due to a few large gains (ranging from 1,000 to 5,000). Because the distribution is being pulled to the right, it is a positively skewed distribution.
The mode of the distribution is the most peaked point on the graph, which is -300, and it is also the most frequent return (34 occurrences) the investment experienced over the past year.
Skewed Distributions Vs. Kurtosis
When discussing a positively skewed distribution, in statistics, it is common to hear about kurtosis, which measures how peaked or flat a distribution is. Kurtosis measures how clustered data points are around the most peaked part of a distribution.
The table below lists a few differences between skewness and kurtosis.
| Skewness | Kurtosis |
|---|---|
| Measures the direction of the skewed distribution. The distribution can be centered (normal), pulled to the right (positive), or pulled to the left (negative). | Measures how peaked or flat a distribution series is. |
| Measures how data points pull the distribution curve to the right or left. | Measures how data points are clustered around the center of the curve. |


Free Resources
To continue learning and advancing your career, check out these additional helpful WSO resources:


or Want to Sign up with your social account?