LOGNORM.INV Function
Learn how to use the LOGNORM.INV function in Excel


What is the LOGNORM.INV function?
The Inverse Lognormal Distribution at a given value of x can be created using the LOGNORM.INV function in Excel.
You would ask, what exactly is an inverse lognormal distribution?
To understand it better, we must visit back to the normal distribution. You must have read one of our articles for normal distributions, which can be created using NORM.DIST function.
A normal distribution is a bell-shaped graph with the maximum number of values concentrated in the middle region while values go on to decrease towards the end.
Further, the lognormal distribution can be created from the normal distribution by plotting the logarithms of random variables.
Apart from the obvious difference, the lognormal distributions only include positive variables instead of normal distributions, including positive and negative ones.
Finally comes the inverse lognormal distribution, which allows the user to go back from the log-transformed values to the original values.
That’s a lot of information to digest but nevertheless quite useful. So let’s return to the article, which will guide you on the LOGNORM.INV function and how to use it.
- The LOGNORM.INV function in Excel is used to calculate the inverse of the lognormal cumulative distribution function at a specified value of x.
- Inverse lognormal distribution allows users to revert from log-transformed values back to the original values, offering a unique perspective compared to normal and lognormal distributions.
- The syntax for the LOGNORM.INV function includes probability, mean, and standard deviation as required parameters.
- The LOGNORM.DIST function is introduced as a counterpart to LOGNORM.INV, with both functions working together to calculate lognormal distribution probabilities and inverses.
Understanding LOGNORM.INV function
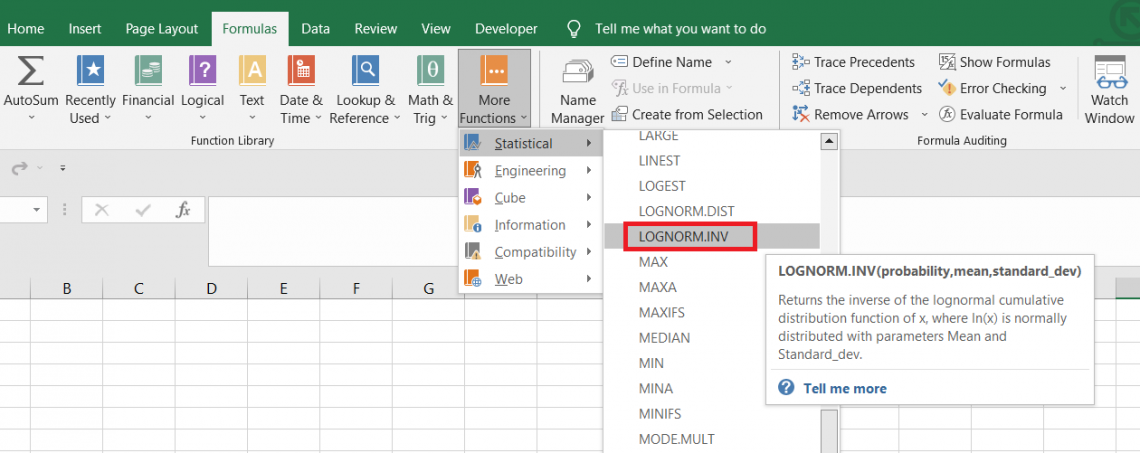
LOGNORM.INV is categorized as a Statistical function that lets you calculate the inverse of the lognormal cumulative distribution function of x in Excel.
For example, if the probability is 0.98, the mean equals 2, and the standard deviation equals 0.3. The value of x using the inverse lognormal cumulative distribution function equals 13.6825.
An inverse lognormal distribution and normal distribution are somewhat related. Although we can change an inverse lognormal distribution into a normal, the reverse isn’t possible since no direct alternative is possible.
You can use the approximation method, but the inverse lognormal distribution would be completely built on assumed values.
However, you can change it into normal distribution by calculating the natural logarithms of the values and then finally calculating the normal distribution using the NORM.DIST function.
We have saved these calculations for the end; for now, let’s focus on the syntax of the LOGNORM.INV function.

The syntax for the LOGNORM.INV function is:
=LOGNORM.INV(probability, mean, standard_dev)
where,
- probability - (required) probability for the lognormal distribution
- mean - (required) the middle value of the lognormal variables
- standard_dev - (required) the standard deviation of the lognormal variables
How to use Inverse Lognormal Distribution in Excel?
Let’s see a really simple example of how the function works. Suppose we have the data as illustrated below:
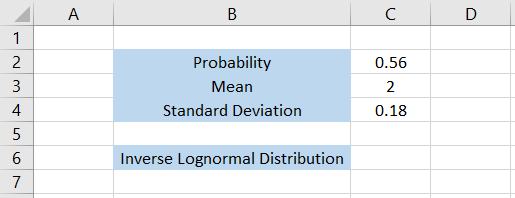
We will just go through the values before we use the formula. The probability for the lognormal distribution is equal to 0.56. This number always be between 0 and 1.
Well, what if the value is higher than 1?
In this case, Excel will return the #NUM! Error since the probability value usually lies between 0 to 100%.
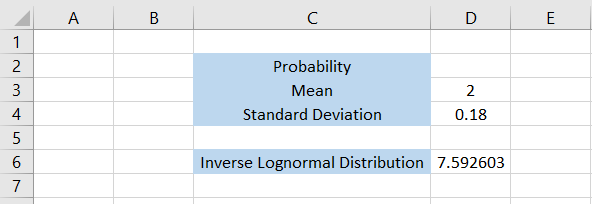
Next, we also have the mean and standard deviation, 2 and 0.18, respectively.
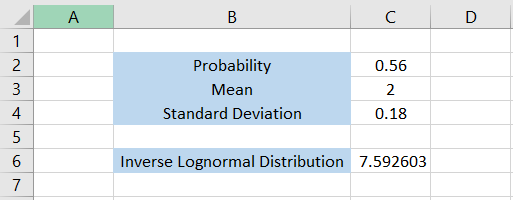
By using the formula =LOGNORM.INV(C2,C3,C4) in cell C6, we get the x value for inverse lognormal distribution as 7.592603.
Let’s see another example quickly to see the result for different numbers. Suppose we have the data as illustrated below:
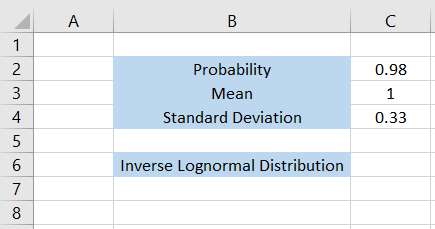
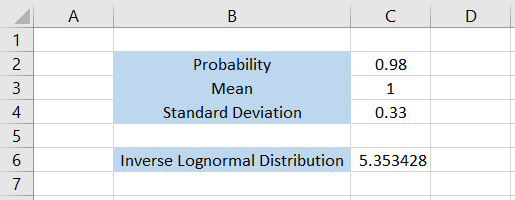
In this case, the probability for the lognormal distribution is equal to 0.98 or 98%, while the mean and standard deviation values are 1 and 0.33, respectively.
We will use the formula =LOGNORM.INV(C2,C3,C4) in cell C6, which gives the result as 5.353428.
That’s how you can calculate the x value for inverse lognormal distribution in Excel. Inverse lognormal distribution will make much more sense once you see how it is linked to the normal distribution in one of the subsequent sections.
On its own, the function becomes difficult to interpret and understand its use cases if you aren’t a mathematical geek!
What is the LOGNORM.DIST Function?
Let’s assume a different scenario. You know that the mean is equal to 2 while the standard deviation is 0.18. The inverse lognormal distribution is equal to 7.592603
What is the probability of the lognormal distribution? The data looks as illustrated below:
To calculate the probability, we will use the =LOGNORM.DIST(D6,D3,D4,TRUE). It gives the result as 0.56.
Wait, what?
So the two functions are actually linked, which is quite obvious from their name.
The LOGNORM.DIST is, not surprisingly, categorized as a Statistical function that returns the lognormal distribution of x in Excel.
The syntax for the LOGNORM.DIST function is:
=LOGNORM.DIST(x, mean, standard_dev, cumulative)

where,
- x - (required) the value for which we are calculating the lognormal distribution
- mean - (required) the mean value for the distribution
- standard_dev - (required) the standard deviation
- cumulative - (required) boolean value determines whether Excel calculates the cumulative or probability density function.
If the value is equal to TRUE, then the function calculates the cumulative density function, whereas if it is FALSE, it calculates the probability density function.
Note
To calculate the probability, we require the cumulative value to be TRUE, which means we are calculating the cumulative density function. You might not get the correct result if you choose the other alternative.
Inverse Lognormal Distribution to Normal Distribution
You might have this question; how do we turn an inverse lognormal distribution into a normal distribution?
This is quite reasonable, as normal distributions are a lot easier to understand.
Let’s see an example of how you can convert inverse lognormal distributions to their normal counterparts.
Suppose we have the data as illustrated below:
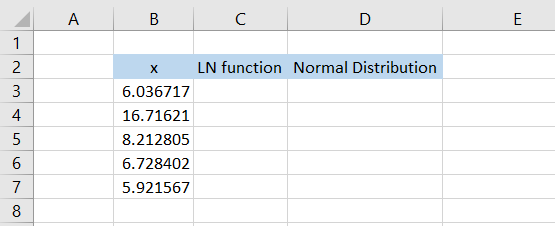
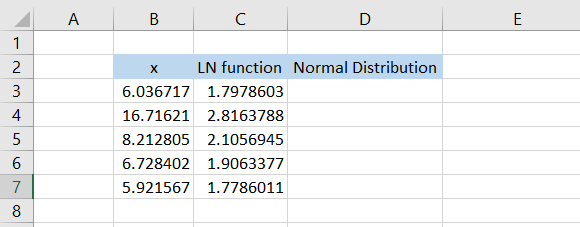
There are a total of 5 values of ‘x’ of the inverse lognormal distribution. Next, we take the natural logarithm of these numbers using the LN function. We will use the formula =LN(B3) in cell C3 and drag it down to cell C7, which gives the result:
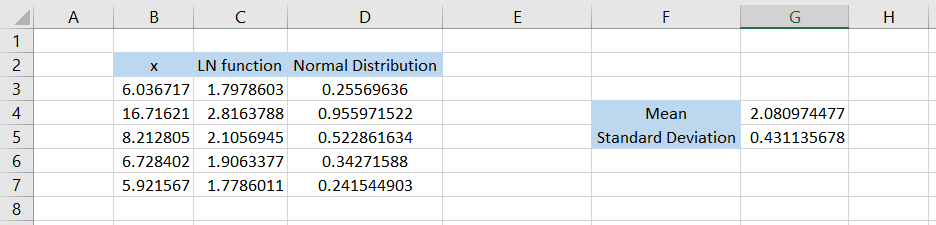
Finally, to calculate the normal distribution, we will also need the mean & the standard deviation from the transformed dataset.
The mean can be calculated using the formula =AVERAGE(C3:C7), which gives the result as 2.080974477, whereas the standard deviation will be calculated using the formula =STDEV(C3:C7), which gives the result 0.431135678.
Finally, we use the formula =NORM.DIST(C3,$G$4,$G$5,TRUE) in cell D3 and drag it down till cell D7, which gives the result:
These values in column D can be used to construct a bell-shaped curve. Would it work? Let’s try and see if it actually works.
Select the data in column D, i.e., range D3:D7, and then click Insert > Charts > Select the scatter plot.
This will give us the result as illustrated below:
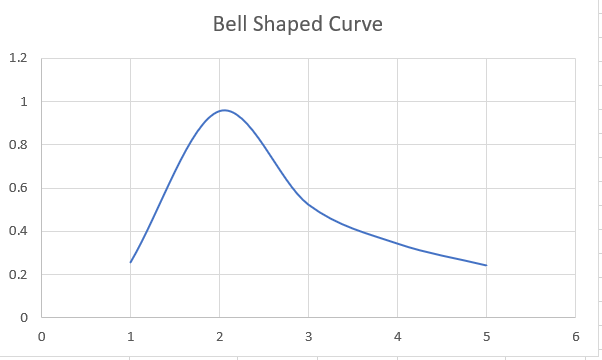
Although it's not a perfect bell-shaped curve, the definition still fits the graph, i.e., a concentration of values in the middle keeps decreasing near the ends.
We hope now it makes sense what the ‘inverse’ lognormal distribution means and how it is connected to the normal distribution.


or Want to Sign up with your social account?