PERCENTILE Function
A statistical function that returns the k-th percentile for values in a referenced range.


What is the PERCENTILE Function in Excel?
The PERCENTILE function in Excel returns the k-th percentile for a range of values in Excel. To understand what the function does, it is essential first to understand what the concept refers to.
Percentile has no universal definition. However, in simplest terms, it can be defined as the number below which a percentage of data falls.
For example, suppose that there are five students in the classroom, and 'Jacob' has scored the second-highest grade. Based on this statement alone, we cannot interpret how Jacob has performed compared to his peers.
All we can say is that he is the second highest-scoring student in the 'entire' class.
A better way to interpret the data is in the form of percentiles, where we can say that 80% of the people have scored less than Jacob in their examination. Hence, we can say that Jacob falls in the 80th percentile because he is the second highest-scoring student.
I am confused about how it is 80th percentile. If we arrange the scores in ascending order, beginning with the lowest scores, then Jacob would be in the fourth position.
Based on this, we will use the formula.
R = P/100(N)
where,
- P = percentile value
- N = total number of values in the dataset
- R = the numerical value for which we are looking at the percentile value
Substituting the values in the formula, we get:
4 = P/ 100 (5)
4 = P/ 20
4 * 20 = P
P = 80th Percentile
Returning to Excel, when you say the k-th percentile, you specify the percentile value as a decimal. This decimal represents the percentile you're looking for in a range of values (usually 0% to 100%).
For example, if we say 20th percentile, the k-th value equals 0.2.
-
Function Overview: PERCENTILE in Excel computes the k-th percentile, aiding in data interpretation by identifying relative positions of values within a dataset.
-
Interpretation Clarity: Percentiles offer clarity in data analysis, enabling comparisons based on relative positions rather than absolute values.
-
Practical Application: Useful for comparing metrics like exam scores or stock prices against a dataset, aiding decision-making processes.
-
Syntax and Usage: Employ "=PERCENTILE(array,k)" where "array" is the dataset and "k" is the desired percentile value between 0 and 1.
-
Compatibility and Evolution: Excel introduced PERCENTILE.INC in 2010, ensuring backward compatibility while promoting newer functions for versatility.
Understanding the PERCENTILE Function
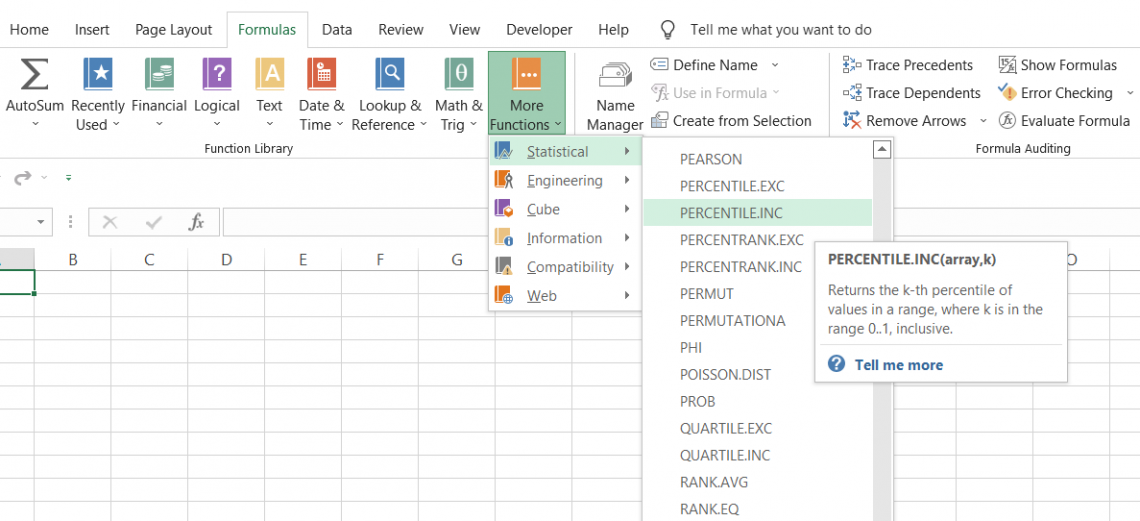
This function is primarily categorized as a statistical function that returns the k-th percentile for values in a referenced range.
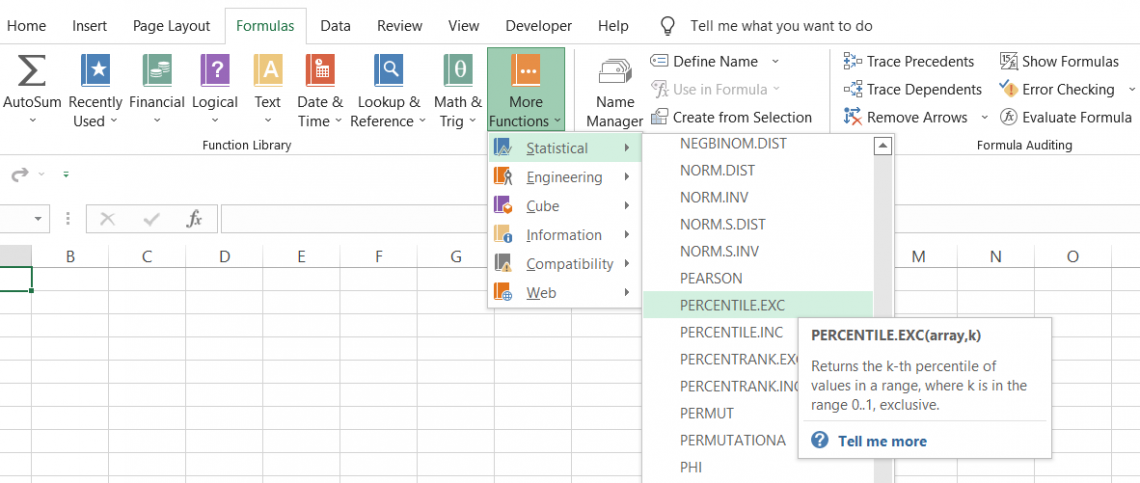
However, if you try to access the function from the Formulas tab, you will find it in the Compatibility section under "more functions" since the role was replaced by PERCENTILE.INC in the 2010 update.
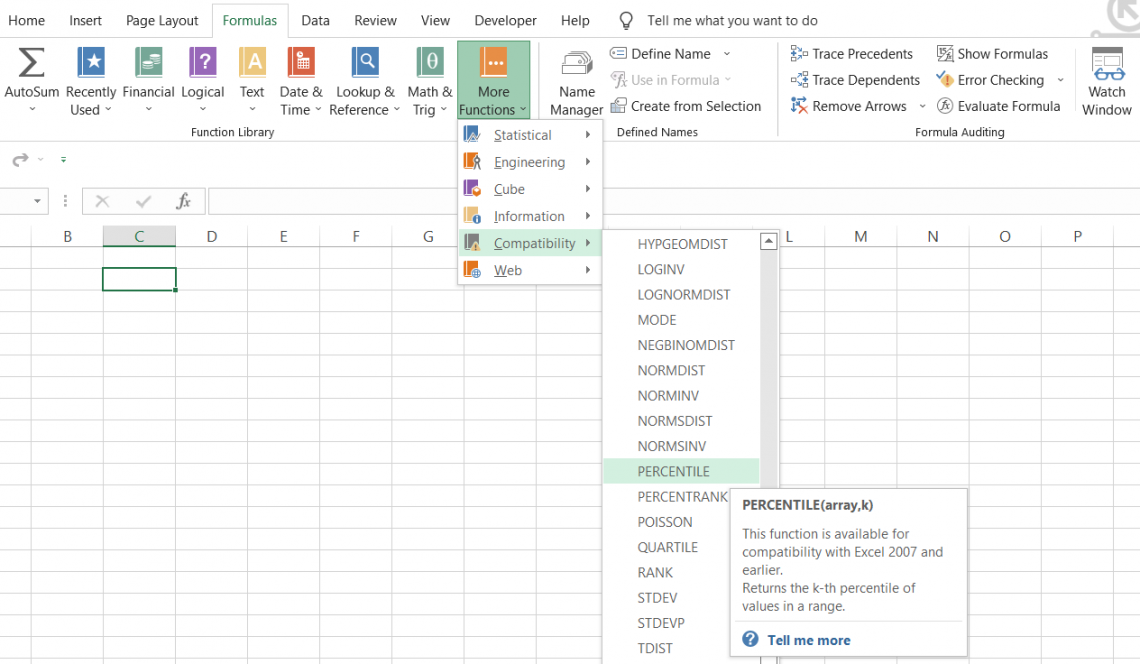
The function is still available in newer versions for backward compatibility, so if someone with Excel 2007 or an earlier version of Excel sends you a file with the formula, it would still work without any problems.
PERCENTILE.INC was introduced in Excel 2010 as a replacement for the previous function and returned the same result for a set of values in the data.
Microsoft does advise you, though, to use the older function only if deemed necessary since it might be later removed altogether.
It is measured in the same units as the inputs used. So, for example, the percentile value would also be given if you measure height in inches.
But the question we haven't yet answered is why even calculate it?
The critical reason is that it helps you to compare a particular value to all the other matters in the data set.
If the value i' is at the 90th percentile, then it means that the value of 'i' is greater than 90% of the values in the dataset.
It can be a bit tricky to understand, but don't worry! By the article's end, we'll ensure that you have already grasped the concept and become an expert at using this function.
Calculating Percentage and Percentile
Many beginners might assume that both concepts are one and the same. However, that is not the case.
Percentage - A percentage can be described as a ratio expressed as a fraction of 100 and is usually represented by the percent symbol (%).
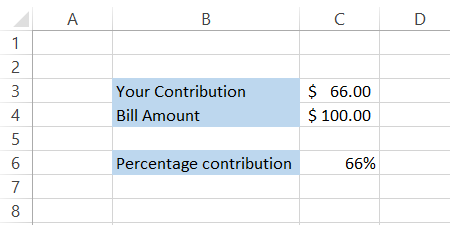
For example, if you make a $66 contribution towards the lunch bill, which came out at $100, you paid exactly 66% of the total.
The calculation begins with your contribution to the total bill amount,66/100, which is then multiplied by 100 to express it as a percentage.
This gives us the final equation as (66/100) x 100 and the result as 66%.
If we were to describe the percentage in two words, we could say it is 'self-obsessed.' When calculating percentages (say bill contributions, exam scores, etc.), you are considering only one person (or data point).
Percentile - This, on the other hand, is a comparison measure among a group of people or in a dataset.
For example, when you compare students' scores and find the 70th percentile value as 68.5, you find that 70 percent of the values in our dataset fall below 68.5.
So if a student has scored higher than 68.5, they are above the 70th percentile, and if they scored below 68.5, they are below the 70th percentile. If they scored exactly 68.5, they are in the 70th percentile.
Syntax
The syntax for the function is:
=PERCENTILE(array,k)
where,
- array = (required) the values in the data
- k = (required) The value between 0 to 1
How to use the PERCENTILE Function in Excel?
Using the function is a total walk in the park. The interpretation might be difficult, especially if you don't always use the function on a daily basis.
But once you understand what it does and how it works, using the function and interpreting the result becomes easier.
Suppose that you have a list of ten student's grades in an English class, as illustrated below:
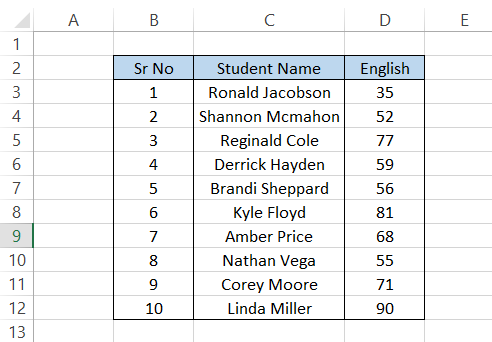
Let's say we intend to find the value at the 80th percentile.
In cell F7, we will begin with the equal sign(=), type in the function name, and then add in our arguments such that our formula becomes
=PERCENTILE(D3:D12,0.8).
The result is "77.8".
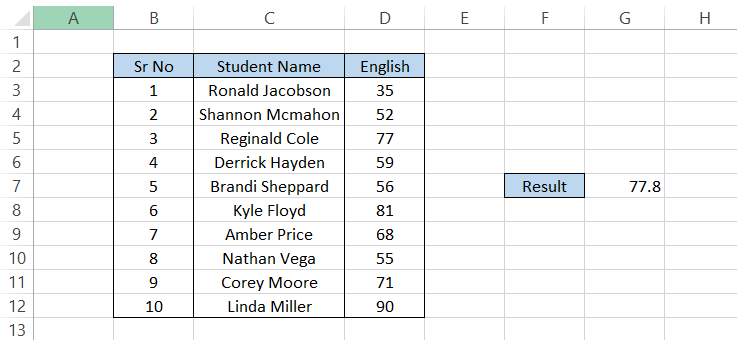
Let us guess; you might be a little confused. There's no 77.8 in our range of scores, D3:D12, yet Excel has returned it in cell G5.
What happened is that the 77.8 is a result of interpolation between two numbers, i.e., 77 and 81, from our data set.
In our formula, we used the value of k as 80%, or 0.8, to get the 80th percentile. From the result, we can interpret that 80% of the values in our dataset fall below 77.8.
If you arrange the values in range D3:D12 in ascending order to understand better, we see that only two values are above our result, 77.8.
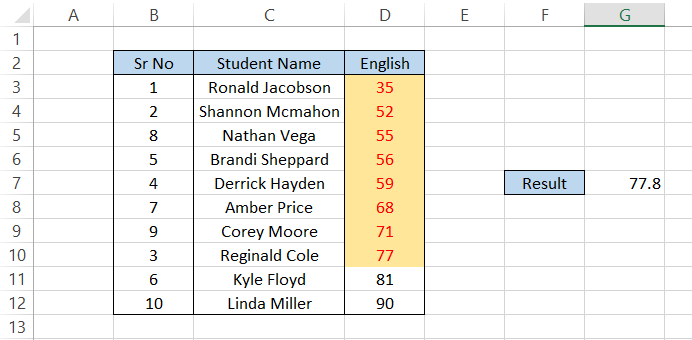
To check, you can divide the number of values below our 80th percentile by a total number of values, which is 8/10, and then multiply it by 100. And voila, 80%!
Similarly, if you want the 20th percentile, you can use this formula:
=PERCENTILE(D3:D12,0.2)
which should return the result as 54.4.
Again, the interpretation would be that only 20% of the values in our dataset fall below 54.4.
As you can see in the spreadsheet, 20% of dataset values below 54.4 include the scores 35 and 52. If you put the dataset in ascending order, the spreadsheet will look like this:
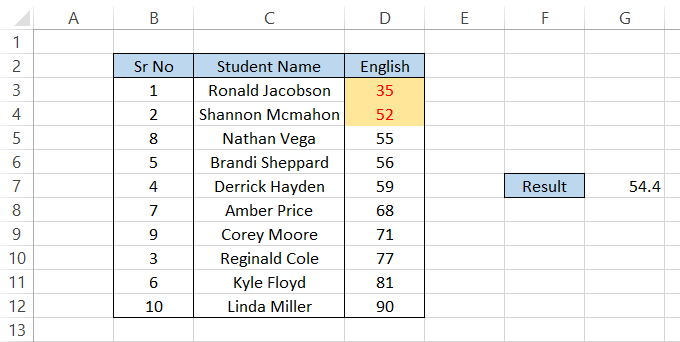
Note that you don't need to sort the data after using the formula. In our examples, the data is arranged in ascending order to help readers better understand what goes on behind the scenes when you use this formula.
PERCENTILE vs. PERCENTILE.INC Function
If you use both functions, Excel will return the same result. Yes, there's absolutely no difference.
You might wonder - What was Microsoft's intention behind discontinuing the PERCENTILE function and introducing a similar function in 2010?
The answer is more versatility. By ditching the old function, they introduced two functions - PERCENTILE.INC and PERCENTILE.EXEC.
The difference between both functions is based on the k-th percentile of the dataset. If the function ends in INC, it means it returns the k-th percentile, including the values 0 and 1.
On the other hand, the function ends in.EXC excludes the values 0 and 1 for the k-th percentile.
The syntax for PERCENTILE.INC function is:
=PERCENTILE.INC(array,k)
where,
- array = (required) values in the data
- k = (required) The value between 0 to 1
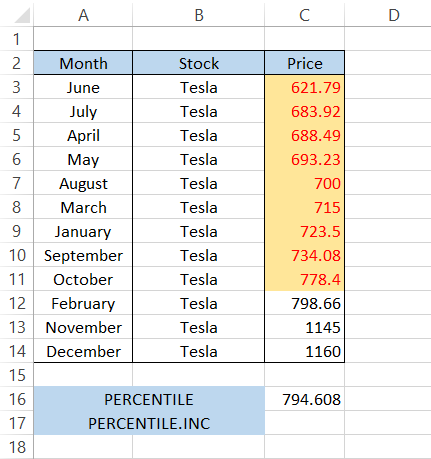
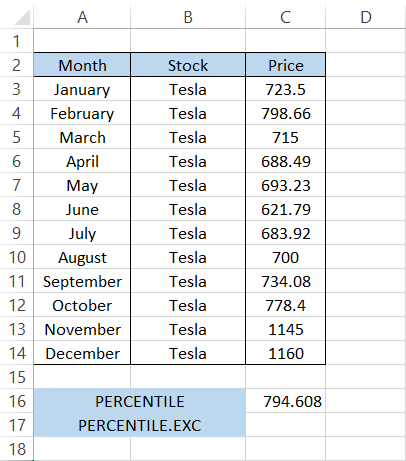
For example, let's say that on the 1st of every month, you purchase two stocks from Tesla for your portfolio. The buying prices are as illustrated below:
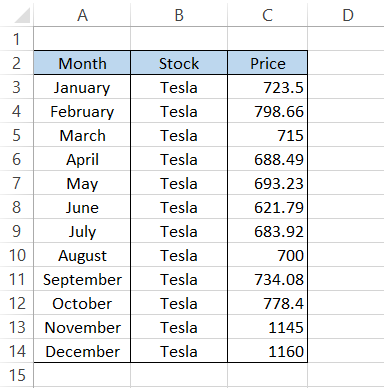
We will find the 80th percentile for the Tesla stock prices.
By using the formula
=PERCENTILE(C3:C14,0.8)
we get the result of $794.608. This means that 80% of the prices are below $794.608.
Sorting the prices from lowest to highest, we find that the prices below $794.608, which fall 80th percentile, are:
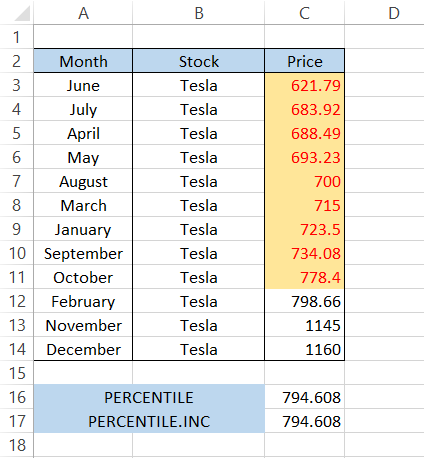
By using the formula
=PERCENTILE.INC(C3:C14,0.8)
In cell C17, we get the same result which is $794.608. Again, the 80th percentile values below $794.608 are highlighted below:
PERCENTILE vs. PERCENTILE.EXEC Function
The function PERCENTILE.EXC will return the k-th percentile, excluding the values 0 and 1.
The syntax for the function is:
=PERCENTILE.EXC(array,k)
where,
- array = (required) values in the data
- k = (required) the percentile value between 0 and 1
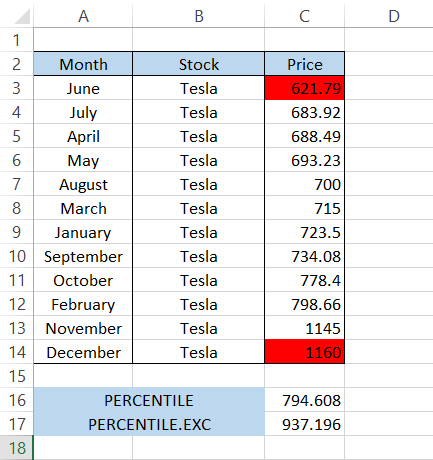
Let's return to our example, where you purchase two Tesla stocks at the beginning of each month. First, we need to find the 80th percentile value. The data looks as illustrated below:
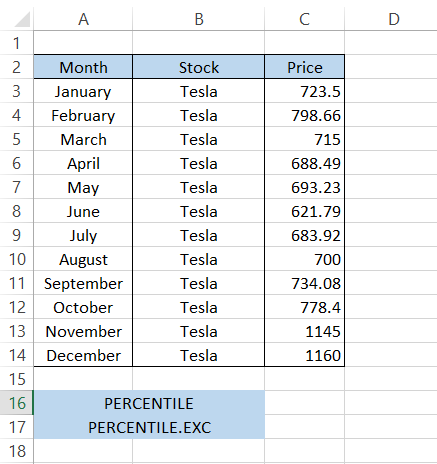
First, we will find the result in cell C16 using the formula
=PERCENTILE(C3:C14,0.8)
giving you $794.608.
On the other hand, by using the formula
=PERCENTILE.EXC(C3:C14,0.8)
Which will give you the result of $937.196. This is quite a different result. But why is the result so different? Let's first arrange our prices in ascending order.
When the k-th value is either zero or one, the function generally uses the lowest and highest values, respectively. As we know, the function excludes the k-th value 0 and 1.
The cells highlighted in red are the lowest ($621.79) and highest ($1,160) prices in our dataset. These are removed because they represent the 0 and 1, or 0th percentile and 100th percentile values.
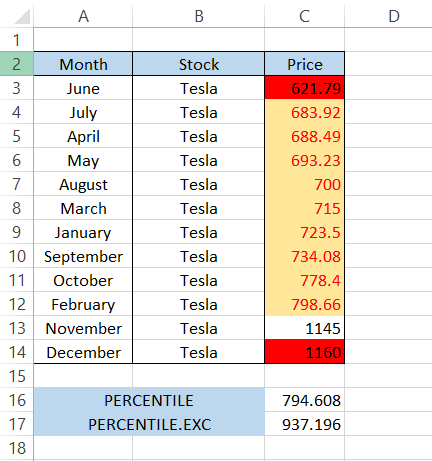
Now excluding those two cells, we still have ten values in our dataset. Thus the prices below the 80th percentile of $937.196 are:
What makes PERCENTILE? EXC special will exclude percentages/ k-th values from 0 to 1/(N+1) along with N/(N+1) to 1 in the result, where N is equal to the input array size.
If you input those k-th values in the formula, then excel will return the #NUM! Error.
For example, our input array size is equal to 12 cells. So based on the exclusion principle, all the k-th values between 0 to 0.076 (1/13) and 0.923 (12/13) to 1 will be excluded from the result and return a #NUM! Error.
PERCENTILE vs. QUARTILE
Many people confuse themselves with the concept of percentiles and quartiles. Though they have some similarities, they are quite different.
It can range anywhere from 0 to 100. However, a quartile can range only from 0 to 4.
The similarities between the two are that:
- The zero percentile is synonymous with the zero quartiles (also called the minimum value).
- The 25th is equal to the 1st Quartile.
- The 50th is equal to the 2nd Quartile (also called the median value).
- The 75th is equal to the 3rd Quartile.
- The 100th is equal to the 4th Quartile (also called the maximum value).
The syntax for the QUARTILE function in excel is:
=QUARTILE(array, quart)
where,
- array = (required) values in the data
- quart = (required) the value can range from 0 to 4
| Level I | |
|---|---|
| 0 | Minimum Value |
| 1 | First Quartile (25th percentile) |
| 2 | Second Quartile (50th percentile) |
| 3 | Third Quartile (75th percentile) |
| 4 | Maximum Value |
Suppose you have a list of English scores for a group of students. Their results are illustrated below:
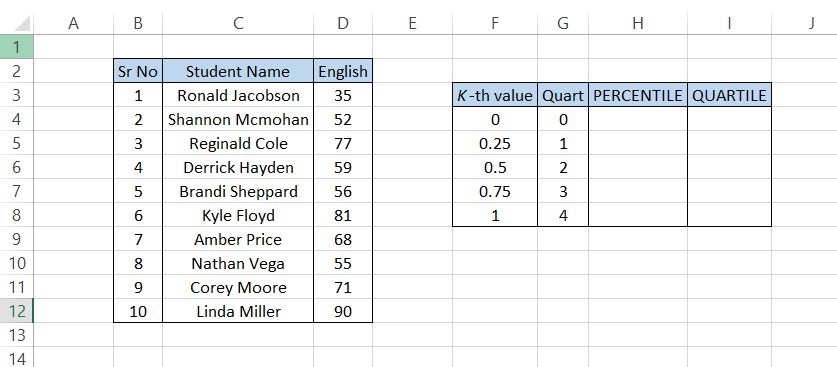
Our k - the argument values for PERCENTILE are in range F4:F8 while the quart argument values are in G4:G8.
To find it, we will use the formula
=PERCENTILE($D$3:$D$12, F4)
in cell H4 and drag it down up to H8, which should give you the result:
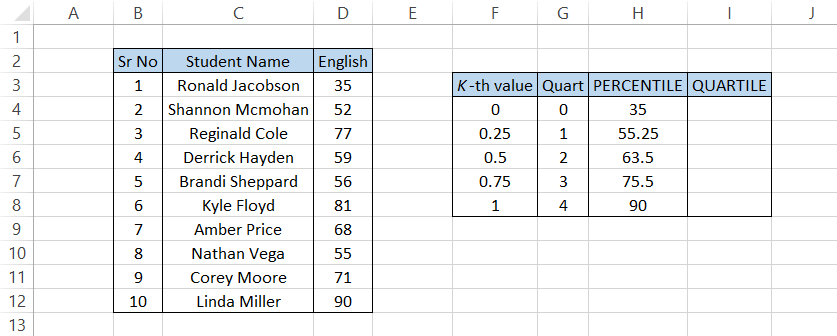
Since we haven't used the dollar sign($) for the cell reference F4 argument, when you drag down the formula, the kth value changes; for example, the 50th percentile is essentially calculated using the procedure
=PERCENTILE($D$3:$D$12, F6)
which gives the result of 63.5.
Similarly, to find the Quartile, we will use the formula
=QUARTILE($D$3:$D$12, G4)
which should give you the same results in column I.
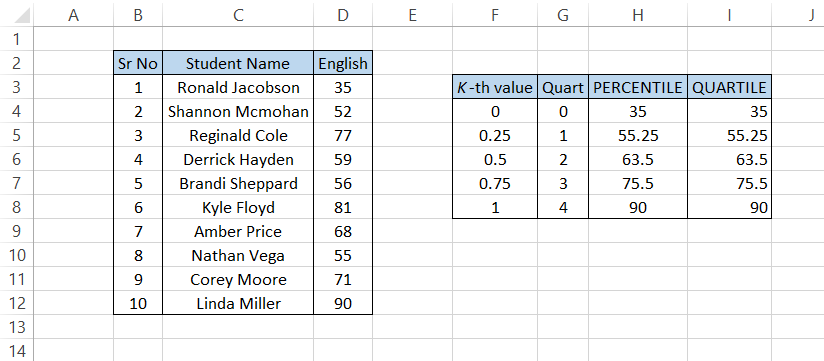
When you drag down the formula, the only cell reference that changes is the G4 argument since we haven't used the dollar sign($) to fix the cells.
When you get the result of 75.5, the formula essentially is
=QUARTILE($D$3:$D$12, G7)
using the quart value as 3.
As shown above, quartiles are a simple way of finding the 0, 25th, 50th, 75th, and 100th percentiles. Note that quartiles are useful for percentiles including 0 and 1, or the zero and one-hundredth percentile.
They can stand in for the PERCENTILE and PERCENTILE.INC functions.
Using the PERCENTILE Function for Outliers
The PERCENTILE function works wonders if you are working on a linear regression model or need to check your data for any outliers.
Suppose you are a real estate analyst and need to look over the property prices for some New York houses.
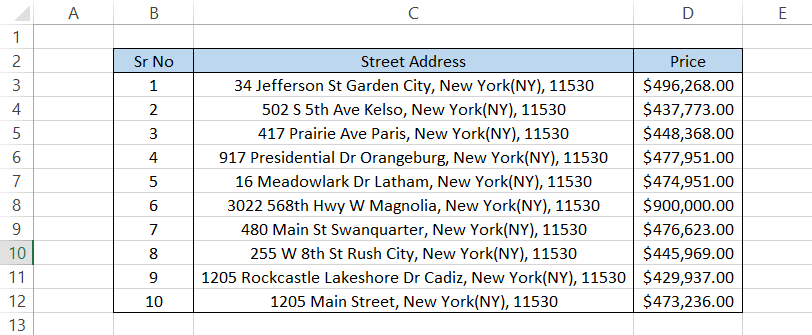
But before you sort these properties from, say, cheapest to expensive, you need to find if there are any outlier values for the prices.
Now having an outlier doesn't necessarily mean that the value is wrong; it could also mean that the house is a lot larger as compared to others on the list. It means that the value is somehow distinct from others on the list and might merit closer examination.
But for this example, we would exclude all those possibilities and just stick to the house price.
By using the =PERCENTILE(D3:D12,0.25) in cell G3, we will get the result of $446,568.75
Similarly, the 50th, 75th, and 100th percentile values will be as illustrated below:
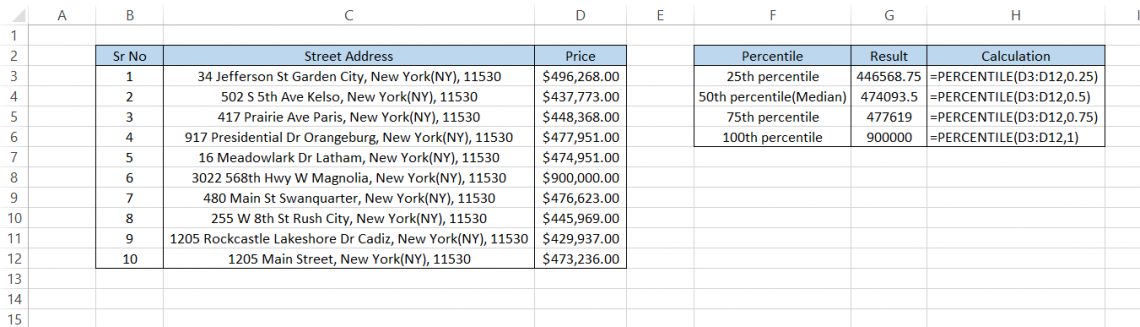
As you might have already noticed, there is a significant difference in the 75th and 100th percentile values. This evidence indicates that there is an outlier value in your dataset.
The outlier might need to be removed in scientific applications before further data analysis. Here, the real estate agent might want to look up the specifics of that $900,000 house, especially since the other houses in the area are much cheaper.
Even though the QUARTILE function can also be used as an alternative here, we prefer to use the PERCENTILE as it gives more flexibility than the former.
Instead of being limited to the quart values from 0 to 4, you can conduct further analysis - perhaps you want to know the 60th percentile.
Important things to remember
- If the argument k is a non-numeric value, Excel returns the #VALUE! Error
- The value of k should lie between the lower and upper range of 0 to 1 (0% to 100%). If the range is crossed by even a 0.000001, then Excel will return the #NUM! Error
- The function interpolates to determine the value at the k-th percentile if k is not a multiple of 1/(n-1).
- PERCENTILE.INC works the same way as PERCENTILE and includes the 0 (lowest) and one (highest values)
- PERCENTILE.EXC excludes the lowest and highest values when calculating it.
- For the 0, 25th, 50th, 75th, and 100th percentile, which are the 0, 1, 2, 3, and 4 quarts, respectively, QUARTILE gives the same result as PERCENTILE.


or Want to Sign up with your social account?