NORM.DIST Function
A statistical function found in Excel that calculates the probability of a range of values


What Is The NORM.DIST Function?
The normal distribution function (NORM.DIST) is a statistical function found in Excel that calculates the probability of a range of values or an exact value occurring.
This function helps calculate more accurate probabilities than a normal distribution table, also known as the z table. Additionally, an Excel function is efficient, especially if the user has to repeat the process several times or does not know the exact statistics behind the function.
A normal distribution is a symmetrical probability distribution shaped like a bell (also known as the bell curve). The data close to the mean (average) occurs more often than further away data.
Because the distribution is a symmetrical bell curve about the mean, the mean, median (middle data point), and mode (most frequently occurring data point) are all the same.
To get the most accurate output from the function, ensure your distribution is normally distributed or that you want your output to predict values as if the data were normally distributed.
- Normal distribution function formula: NORM.DIST(x, mean, standard_dev, cumulative)
- “cumulative” is the only section to accept non-numerical values: either “TRUE” for a cumulative distribution function or “FALSE” for a probability mass function.
- Mean function formula: μ =AVERAGE(number1:[number2])
- Standard deviation function formula: σ =STDEV(number1:[number2])
- Common errors for the normal distribution function formula:
- #NUM!: resolve the error by inputting a valid standard deviation.
- #VALUE!: resolve the error by inputting numerical values for standard deviation and mean.
- NORM.S.DIST has the same purpose as NORM.DIST but requires different arguments.
- NORM.DIST is NORMDIST on older versions of Excel.
formula for NORM.DIST
When using Excel, it is crucial to understand how key functions work and what needs to be inputted for accurate outputs. This program is precise, so using arguments that do not follow the correct syntax could lead to inaccurate answers or error messages.
Thus, we will be discussing the correct syntax for the normal distribution function and those for the mean and standard deviation functions, as the latter two are important to the first.
1. Normal Distribution
NORM.DIST(x, mean, standard_dev, cumulative)
Where
-
x: The value wanted for the distribution
-
mean: The calculated arithmetic mean of the distribution, often represented with μ (mu). The mean is the average value
-
standard_dev: The calculated standard deviation of the distribution, often represented with σ (sigma). The standard deviation shows how spread apart the data points are from the mean
-
cumulative: Either “TRUE” or “FALSE”
-
TRUE: used to find the probability of a value being less than or equal to x. When “TRUE” is selected in statistics, the function is a cumulative distribution function (CDF)
-
FALSE: used to find the probability that a value equals x. When “FALSE” is selected in statistics, the function is a probability mass function (PMF)
-
3. Mean
μ =AVERAGE(number1:[number2])
Note that “number1” and “[number2]” are cell names, hard-coded values, or ranges for which the user would like to calculate the mean.
3. Standard Deviation
σ =STDEV(number1:[number2])
Note that “number1” and “[number2]” are cell names, hard-coded values, or ranges for which the user would like to calculate the standard deviation.
The Examples of mean and standard distribution in Excel are illustrated below:
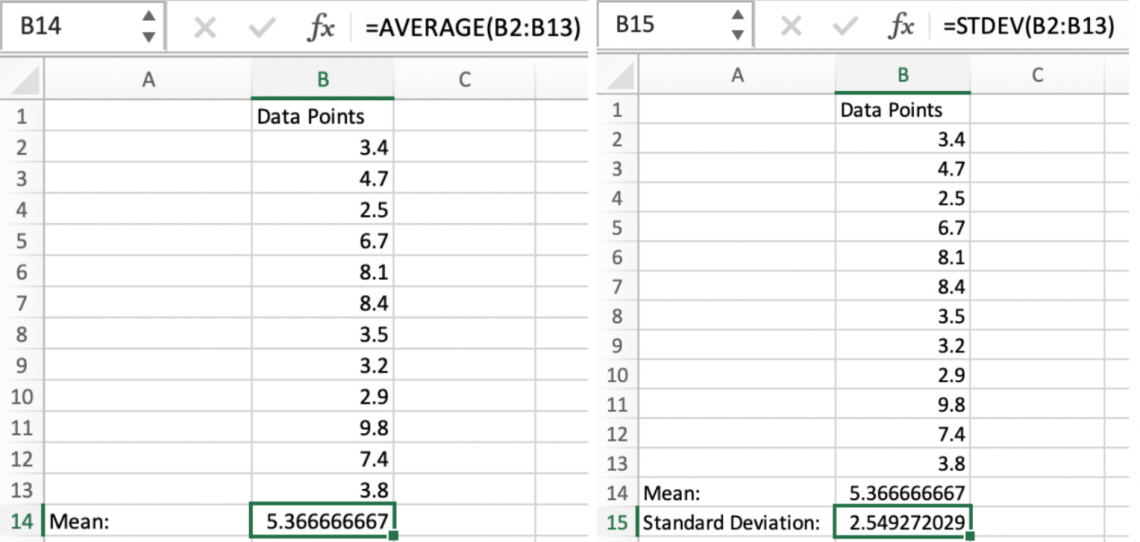
In the images above, we can see how, by inserting the cell names into the given formulas, we can get the mean and standard deviation of these data points.
This will be helpful in future examples, as we will use this mean and standard deviation throughout this article.

Examples of NORM.DIST function in Excel
Some examples are explained below:
Example 1: NORM.DIST less than or equal to 5.0
Because we already have the mean and standard deviation, we can use the cell names in the formula instead of typing out the number.
For the cumulative section, we will type “TRUE” to indicate that we want the probability that a point is less than or equal to the “x” value.
After entering the formula, we get a value that shows the probability of a value being less than or equal to 5.0 if our distribution is normal. This probability is approximately .4428, denoted as P(x≤5.0)≈.4428, or 44.28%.
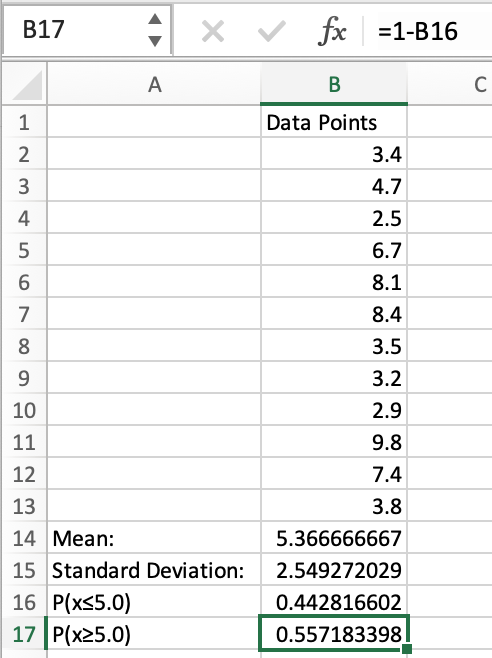
Example 2: NORM.DIST greater or equal to 5.0
In reference to example 1.1, we can subtract .4428 from 1, which would give us the inverse of what we previously calculated.
So, if our distribution is normal, the probability of a value being greater than or equal to 5.0 would be approximately .5572, denoted as P(x≥5.0)≈.5572, or 55.72%.
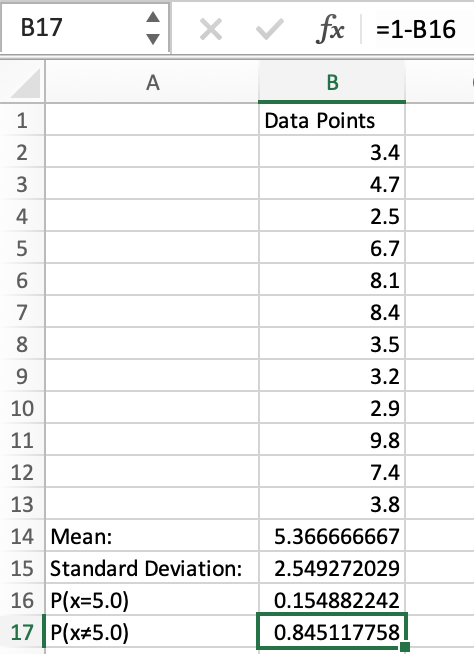
Example 2.1: NORM.DIST is not equal to 5.0
For example 2, we can subtract .1549 from 1, which will get us .8451, denoted as P(x≠5.0)≈.8451, or 84.51%.
This means that if our data were normally distributed, there would be an 84.51% chance that a random value would not be 5.0.
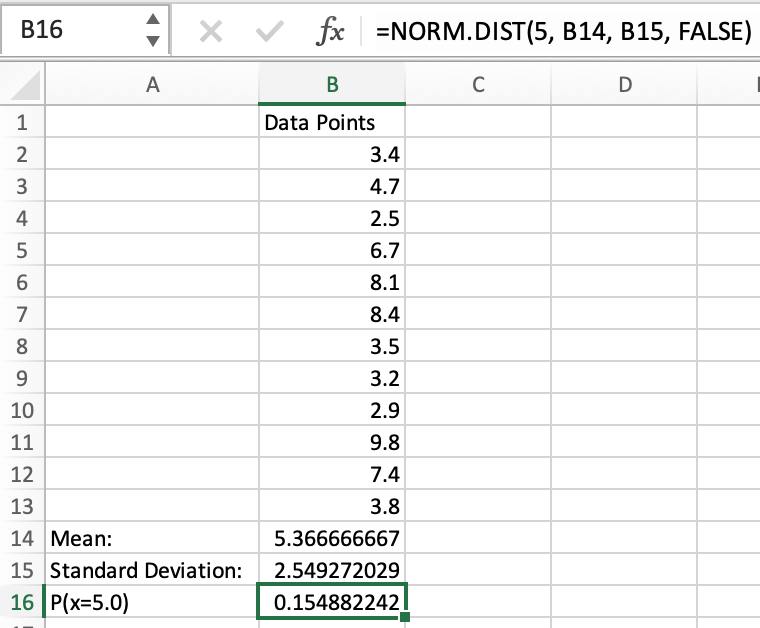
By entering our formula, we can now interpret that if our data was normally distributed, the chance of a value being 5 is .1549, denoted as P(x=5.0)≈.1549, or 15.49%.
Example 3: NORM.DIST equal to 5.0
Because we have already calculated the mean and standard deviation, we can use the respective cell names in the formula instead of manually typing in the numbers.
For the cumulative section, we will type “FALSE” to indicate we are looking for the probability of a value equaling the “x” value.

Error messages with NORM.DIST Function
As mentioned above, the user must precisely input data into Excel formulas to get accurate outputs.
Nevertheless, mistakes are bound to happen, so we will discuss some common mistakes users make that lead to error messages.
-
#NUM!: This message will display in the cell if the standard deviation is zero or a negative number. A negative standard deviation is not mathematically correct, and a standard deviation of 0 indicates no variation within the data points.
-
Users can fix this problem by entering a valid standard deviation. Users may choose to recalculate the standard deviation by using its Excel formula.
-
-
#VALUE!: This message will display in the cell if the standard deviation and/or the mean are non-numerical values.
-
Users can fix this issue by entering a numerical standard deviation and/or mean.
-
These errors exist because it alerts the user that they have inputted values that are not mathematically sound. Statistics require precision; these error messages help the user get exact probabilities.
Excel is a helpful tool but requires some critical thinking to use efficiently. However, by understanding the statistics behind the function and the arguments the formula requires, a user can avoid these error messages and receive highly accurate outputs.
NORM.DIST vs. NORMDIST vs. NORM.S.DIST
Along with the normal distribution formula, denoted as NORM.DIST, there is a standard normal distribution formula, denoted as NORM.S.DIST.
In older versions of Microsoft Excel, NORM.DIST was written as NORMDIST, and either will work on current versions of the application. Some key differences between the three formulas can be found below:
- NORM.DIST and NORM.S.DIST are theoretically very similar, as they are both used to calculate probabilities. However, a standard normal distribution can only be used when the mean is 0, and the standard deviation is 1.
- In the examples provided above, we cannot use NORM.S.DIST unless we were to standardize the distribution.
- The Excel formulas between NORM.DIST and NORM.S.DIST are quite different. As previously mentioned, the formula for a normal distribution is NORM.DIST(x, mean, standard_dev, cumulative).
- The formula for a standard normal distribution is NORM.S.DIST(z, cumulative). The “z” (as in z-score) is similar to “x,” as they are both the values wanted for the distribution, and the “cumulative” part is the same in both formulas.
- The NORM.S.DIST function does not ask for the mean and standard deviation because they are assumed to be 0 and 1, respectively.


or Want to Sign up with your social account?