NPER Function
A part of the Excel Financial Functions that helps to calculate the time period for loan repayment or the duration to achieve an investment goal.


What Is The NPER Function?
The NPER function is part of Excel Financial Functions that help calculate the time period for loan repayment or the duration to achieve an investment goal.

Loans and investments play a fundamental role in economic systems, driving growth and financial stability for individuals.
Loans enable individuals and businesses to access funds for various purposes, from making household purchases to working capital requirements. On the other hand, investments help to shape an individual's future well-being and insure themselves against adversities.
However, neither loans are free nor are investments. In each case, monthly or annual payments are made based on the terms finalized to receive a final amount that individuals can use.
For loans, the amount received is first, including the interest charged, whereas for investments, the amount is received at the end, along with the interest component.
Since the time period becomes crucial in calculating loan and investment amounts, Excel has introduced the NPER function, which helps find the time corresponding to those amounts.
In this article, we will see the NPER function, how it works, and a couple of functions.
- The NPER function is an Excel Financial Function used to calculate the number of periods required to pay off a loan or investment based on fixed periodic payments and a constant interest rate.
- Users provide arguments such as the interest rate, payment amount, present value, and future. Given the specified payment amount and interest rate, thee. The function returns the number of periods needed to reach the future rate.
- Potential errors that users might encounter when using the NPER function, such as providing non-numeric values or referencing cells with incorrect data, and how to address them effectively.
- The NPER function aids in financial planning by helping users estimate the duration of loan repayments or investment periods. This allows them to budget effectively and set realistic financial goals.
Understanding The NPER Function
NPER function is categorized as a financial function that calculates the time period for a loan or an investment based on periodic payments and a constant interest rate.
To understand how the NPER function works, let's consider an example. Suppose you make $200 of monthly payments in an investment vehicle, and it grows at an interest rate of 5% to give you the final corpus of $5,600. Then the time period of the investment would equal 2.317 years.
As you can see, three important components are used in calculating the time period: the monthly payments, the value of a loan or investment, and finally, the interest rate.
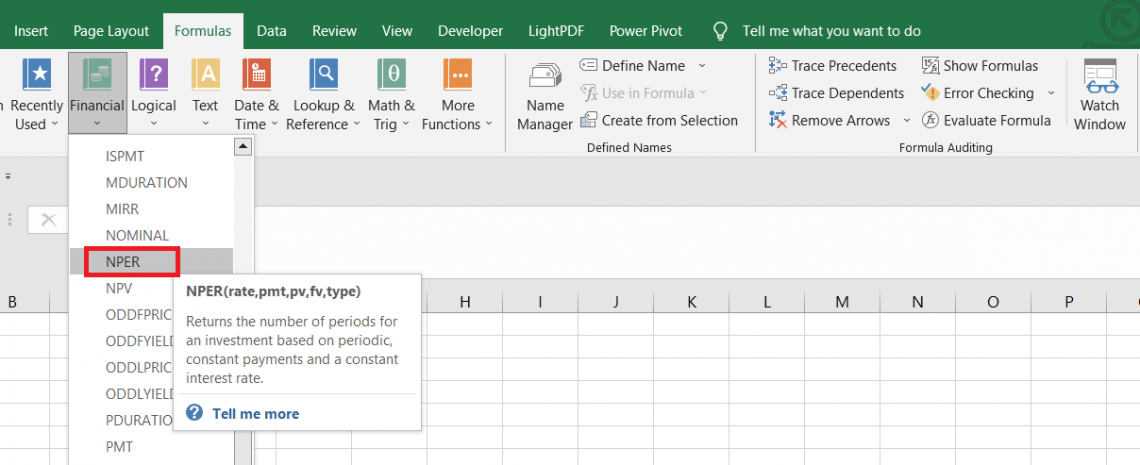
It’s not surprising that even the NPER function has similar components for its syntax, as illustrated below:
=NPER(rate, pmt, pv, [fv], [type])
where,
- rate: (required) the interest rate on the loan or investment. The rate varies depending on whether it is represented as monthly, quarterly, or yearly.
- pmt: (required) payments made in each period.
- pv: (required) the present value of the loan or the investment. If the pv argument is ignored, the value is assumed to be zero.
- fv: (optional) the loan's future value or the investment. If the fv argument is ignored, the value is assumed to be zero.
- type: (optional) defines the instance of when the payments are made. It accepts two values, 0 and 1.
If the value is equal to zero, the payments are assumed to be disbursed at the end of the time period in the NPER function, whereas if the value is equal to one, then the payments are assumed to be disbursed at the beginning of the period.
Example of the NPER Function
Suppose you want to contribute $300 per month, which you believe will grow at 6% to generate a corpus of $10,000.What would have been the time period for the monthly investment to grow from $0 to $10,000? The data looks as illustrated below:
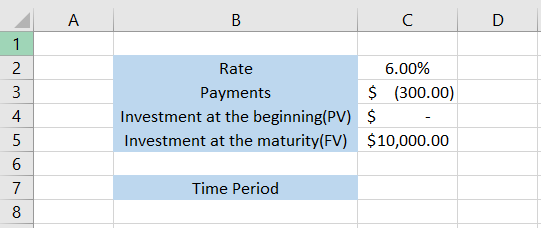
Since the payments are monthly, we need to use the monthly rate rather than the annual rate, which is mentioned in cell C2.
By leveraging the power of the NPER function, we will use the formula =NPER(C2/12,C3*12,C5,1), which gives the time period as 2.751.
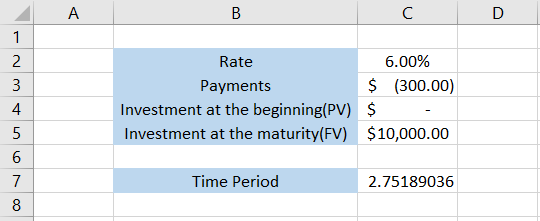
Thus, we can interpret that if $300 is invested monthly for 2.75 years, the total investment corpus will be $10,000 after growing at a 6% rate.
A simple math calculation of $300 per month for 2.75 years gives the approximate result of $9,906.
If we subtract this number from $10,000, the remainder is the interest component earned over 2.75 years.

The time period for investment with different payments periods
The time period for an investment can vary based on different payment periods. Let's explore how the time period changes for monthly, fortnightly, quarterly, and annual payment intervals.
a. Monthly
Let's see an example to understand how the investment value varies with monthly payments. The data looks as illustrated below:
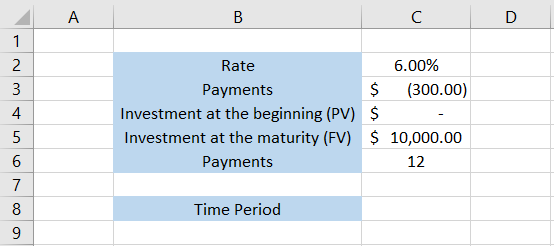
A general assumption we make is that all the payments are made at the end of the period.
To get the time period to reach an investment value of $10,000, we will use the NPER function such that the formula =NPER(C2/C6,C3*C6,C4,C5,0), giving the result 2.76 years.
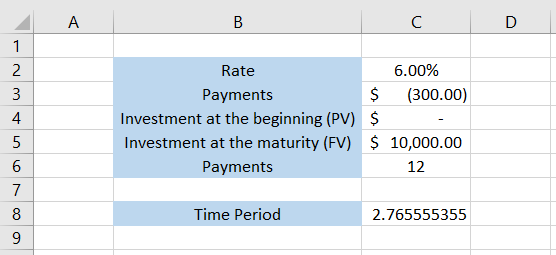
Thus, it will take 2.76 years to reach an investment amount of $10,000, where the payments occur on a monthly basis.
b. Fortnightly
Once you understand how the monthly payments work, it becomes pretty easy to determine how the other types of payments would work.
For a fortnightly time period, 24 payments would occur. So we just change the value in cell C6 to 24 while the formula remains the same to give the result:
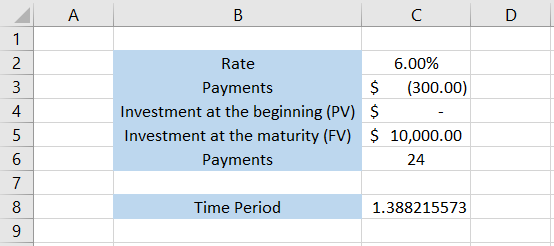
Thus it takes 1.38 years to get the investment amount of $10,000, where all the parameters remain the same except the number of payments.
c. Quarterly
We know there are four quarters in a year; thus, we just need to change the payment number to 4.
The formula still remains =NPER(C2/C6,C3*C6,C4,C5,0), which give the result as:
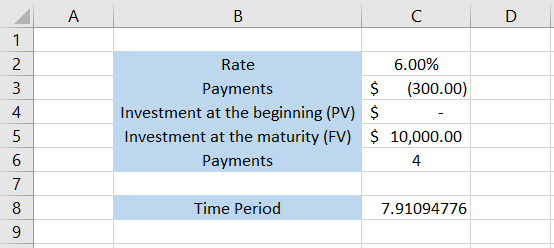
Thus, when the investment is built on a quarterly basis, it will take 7.91 years to reach the investment goal of $10,000. Since the number of payments is less than others, it takes longer to accumulate the investment amount.
d. Annual
Finally, to calculate the time period for investment where payments are made once a year, we change the value in cell C6 to 1.
The formula still remains the same, i.e., =NPER(C2/C6,C3*C6,C4,C5,0) to give the result as:
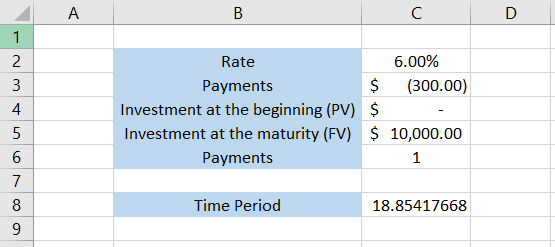
According to the inputs, the investment will take 18.85 years to grow to $10,000 at 6% if annual payments of $300 are made towards the investment goal.
Practical Example of the NPER Function
In this section, we will see an example of calculating the time period for an investment and a loan.
a. Time Period for an Investment
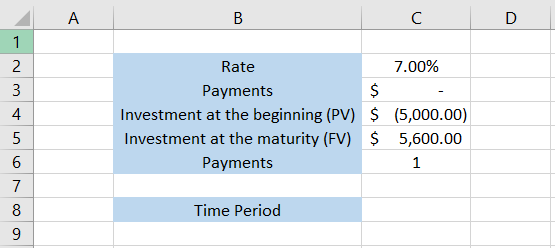
Suppose you make a lump sum investment of $5,000 in Microsoft Inc stock. No monthly payments are involved; however, you expect the investment to grow by 7% to $5,600.
What would be the time period required for the growth of the investment? The data looks as illustrated below:
To get the time period, we will use the formula =NPER(C2/C6,C3*C6,C4,C5,0), which gives the result of 1.67 years.
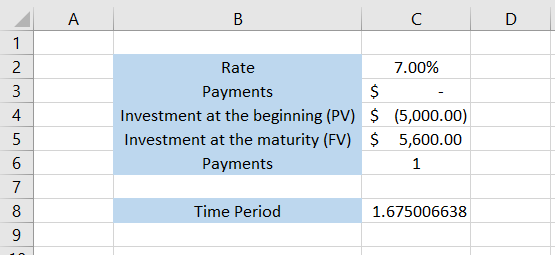
Since no payments are made after the lump sum amount, either dividends or the price appreciation will result in the investment value being $5,600 after 1.67 years.
Let’s say we also make a yearly payment of $300.
In this case, the time period decreases to 0.92 years or less than a year to accumulate the investment amount of $5,600.
b. Time Period for a loan
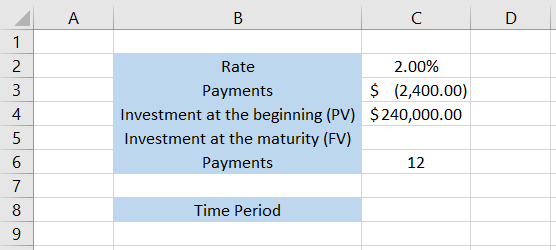
Let's try and run a different scenario. Suppose you take a housing loan of $240,000 at a 2% interest rate, wherein you make $2,400 monthly payments. What would be the decided time period of the loan based on predefined conditions?
The data looks as illustrated below:
The time period of the loan will be calculated using the formula =NPER(C2/C6,C3*C6,C4,C5,0), which gives the result as:
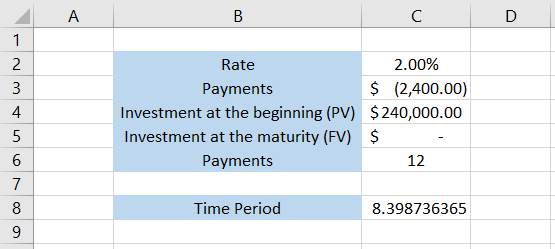
Thus, it will take at least 8.39 years to repay the entire loan and the interest component.
Suppose we agree to the above-mentioned terms but want to make a balloon payment of $50,000 at the end. What will be the time period to reach the loan value of $50,000?
In this case, we will add the FV as $50,000, which gives the time period as
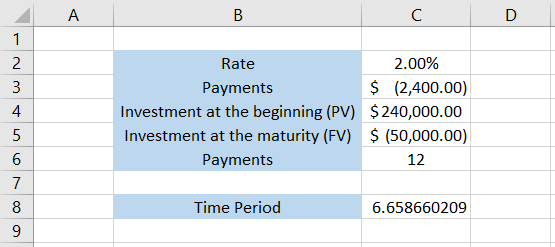
Thus, the loan will end approximately two years earlier if you pay off the loan with a final balloon payment of $50,000.

Free Resources
To continue learning and advancing your career, check out these additional helpful WSO resources:


or Want to Sign up with your social account?