T.DIST.RT Function
A function that showcases the right-tailed t-distribution for a specific set of data


What is the T.DIST.RT Function?
The T Dist Rt function is a function in Excel that displays the right-tailed student’s t-distribution for a specific set of data. One thing to note is that the t-distribution is represented by a bell curve, similar to the normal distribution but flatter.

So, the T Dist Rt function computes the probability of a random variable taking on a certain value or a value within a specified range.
It becomes particularly insightful for business and financial analyses through the use of random variables, as well as hypothesis testing and statistics in general.
In Excel, the syntax for the T Dist Rt command takes the following form:
T.DIST.RT(x, deg_freedom)
The T Dist Rt function complements and is used alongside other functions related to the t-distribution, such as T.DIST.2T, TDIST, and T.DIST, which are described below:
1) T.DIST.2T
Similar structure but a two-tailed test for the distribution for x. It uses the variable x and degrees of freedom.
2) TDIST
Showcases the probability of the distribution for a particular x by incorporating 3 variables instead of 2. The addition is “tails” to specify if we are working with a one-tailed or two-tailed test.
3) T.DIST
Similar to T.DIST.RT, but essentially for the left-tailed test. In addition to the variable x and the degrees of freedom, the “tails” part now focuses on “cumulative,” which is the specific value that dictates the form of the function.
- Cumulative is TRUE → displays the cumulative distribution.
- Cumulative is FALSE → displays the probability density function.
There are two main components in the T Dist Rt formula, which are:
- X: the value to be inserted into the formula for evaluating the distribution
- Deg_freedom: the number of degrees of freedom for the particular data being studied
- The T Dist Rt function showcases the right-tailed t-distribution for a specific set of data, and takes the form of T.DIST.RT(x, deg_freedom) incorporates an x variable value and a number of degrees of freedom for the distribution of the specific data being studied.
- Regarding t-distribution, it is an integral part of hypothesis testing and statistics, with applications to business and other financial areas of data analysis.
- The T Dist Rt function focuses on the right-tailed distribution, while T.DIST, TDIST, and T.DIST.2T concentrate on other aspects of the student’s t-distribution.
- The T Dist Rt function only allows numeric values to be inserted for the variable x or degrees of freedom cells, and the number of degrees of freedom must always be greater than 1. If these are not met, the #VALUE! and #NUM! Errors arise, respectively.
Understanding the T.DIST.RT Function
The formation and style of the elements not only affect the numerical value of the function’s result for a particular set of variables but can also generate some errors.
These occur as described below:
- If the number typed for degrees of freedom is not an integer value, the value will be truncated. So this means reducing the number of digits right of the decimal point.
- If the input inserted for x or the degrees of freedom is non-numeric, the T.DIST.RT function will showcase the #VALUE! Error.
- If the number inserted for degrees of freedom is less than 1, the T.DIST.RT formula will show the #NUM! Error.
There are two instances when you should not use the T.DIST.RT function, which is outlined below:
- When the data you are working with is not linear.
- When trying to find the probability of more than two events happening.
Note
The format of the data being used matters, and it must be linear. Also, T.DIST.RT can only work with one event at a time. For the probability of more than two events happening, you would need to use T.Dist.2T for a two-tailed test instead.
How to use the T.DIST.RT Function in Excel?
To calculate the T Dist Rt function, we need to start with a set of values for the x variable and the number of degrees of freedom.
We must type the formula to calculate the T Dist Rt function: "=T.DIST.RT.” After that, we can select the cell references or manually type the numbers corresponding to the specific variable x and the degrees of freedom for the particular row’s result.
Thus, these two values are inputted into the formula and written within the parentheses, with a comma separating them. The relevant cells for applying the function in the second row are highlighted. The formula is also displayed in the fx box above the rows and columns of data.
The screenshot below demonstrates sample values, and the execution of the formula for the numbers in the second row is highlighted as follows:
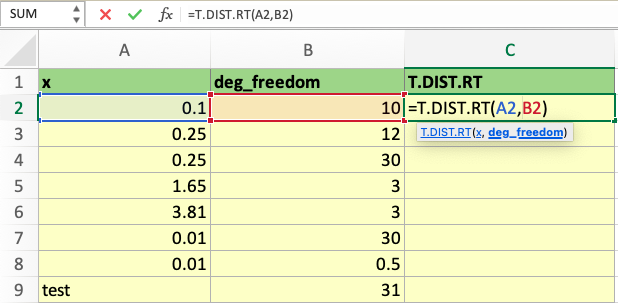
So, for example, for an x variable of 0.1 (cell A2) and 10 degrees of freedom (cell B2), running the T Dist Rt function will look like the screenshot above. However, after hitting the Enter key, it generates a result for cell C2, as showcased in the following screenshot:
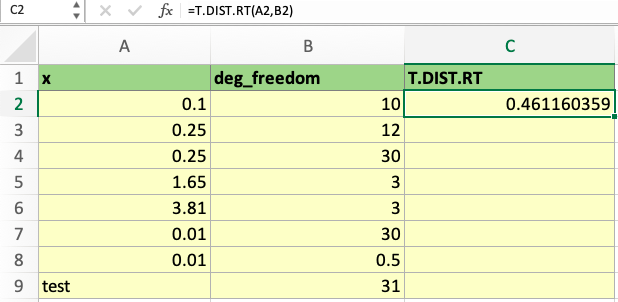
Highlighted in green is the outline of cell C2, which reveals the answer to the formula based on the values in A2 and B2.
From there, the T Dist Rt function can be applied to any set of parameters for the x variable and the number of degrees of freedom as long as both are numeric values and the number of degrees of freedom is greater than 1.
Even though the formula can be applied by repeatedly typing it and selecting the relevant cell numbers for each row, there is a simpler way to do it, which is useful when handling large data sets.
That said, the same formula can be applied to generate the results for cells C3 to C9 by using the AutoFill Handle, by clicking on the square in the bottom right corner of the highlighted cell, C2, and dragging it down to cover cells C3 to C9. This is demonstrated below:
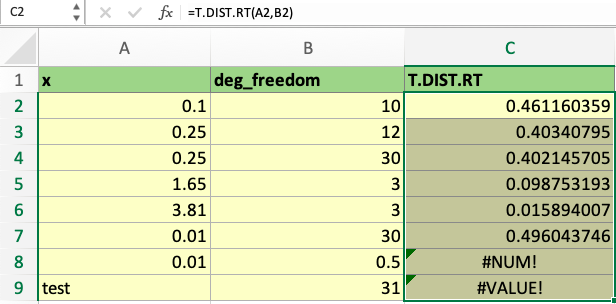
As shown in the screenshot above, the T Dist Rt function displays various numbers based on the given values for the computation result. This also reveals the relationships between the values and how it causes the changes in the function’s result.
However, cells C8 and C9 illustrate how errors arise. Looking at the 8th row, 0.5 degrees of freedom is an invalid input, leading to the #NUM! Error. The function detected a non-numeric value at the 9th row, which led to the #VALUE! Error.


or Want to Sign up with your social account?