CORREL Function
An Excel Statistical Function that calculates the correlation coefficient between the dataset of two variables.


What is the CORREL Function?
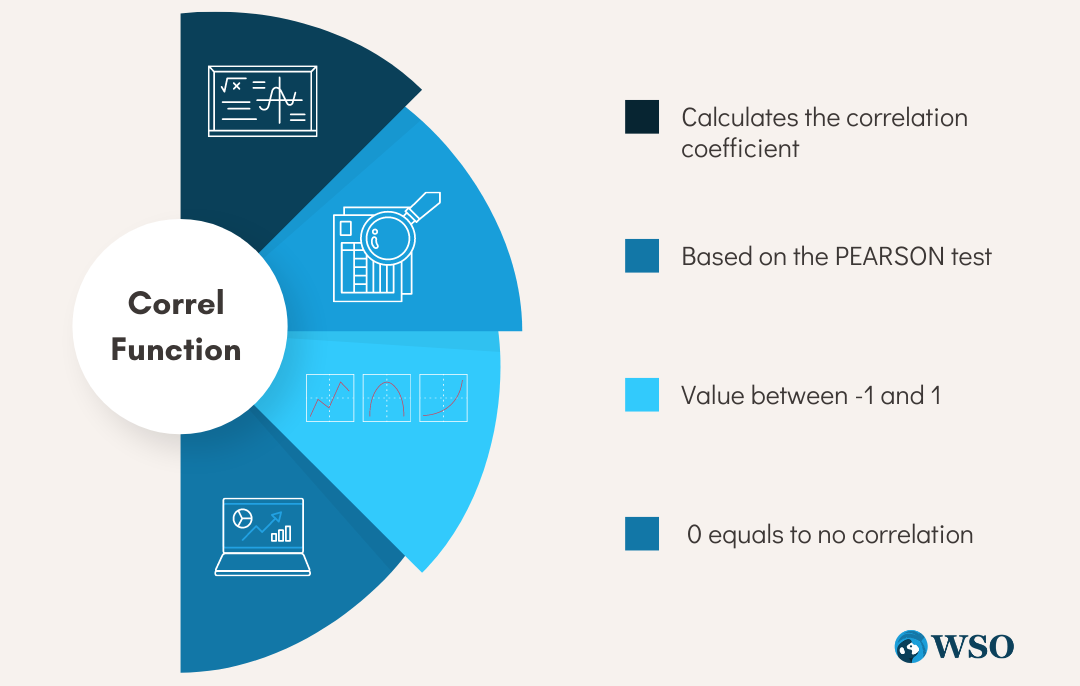
The CORREL function is an Excel Statistical Function that calculates the correlation coefficient between the dataset of two variables. The function measures the direction and strength of the relationship between variables showing how closely related they are.
In simple terms, it measures the strength of a linear relationship between two variables. For example, the mileage of cars would vary for different models and depend on the fuel you buy from the gas station.
If you buy 3 gallons of gas, car A can travel around 60 miles. On the other hand, car B might only travel 50 miles for the same fuel.
A correlation can be drawn between the amount of fuel and the mileage that the car travels, and it can be portrayed whether all the cars in the fleet show similar fuel consumption capabilities.
If there is a linear relationship between the two variables, it indicates that there is some correlation between the datasets.
This linear relationship is known as the correlation between the variables and can be calculated using this function.
In this article, we will learn the function's syntax, how to use it, and a couple of examples.
- The CORREL function is an Excel Statistical Function used to calculate the correlation coefficient between two sets of data points, indicating the strength and direction of their linear relationship.
- Users provide two arrays of data points - one for each variable. The function returns the correlation coefficient, which ranges from -1 to 1, where -1 indicates a perfect negative correlation, 0 means no correlation, and 1 indicates a perfect positive correlation.
- Users might encounter potential errors when using the CORREL function, such as providing arrays with unequal lengths or referencing cells with incorrect data and how to address them effectively.
- CORREL function finds applications in finance, economics, and other fields where analyzing relationships between variables is essential for decision-making, risk management, and forecasting.
Understanding CORREL function
The CORREL is categorized as a Statistical function that calculates the correlation coefficient for two sets of values from random populations.

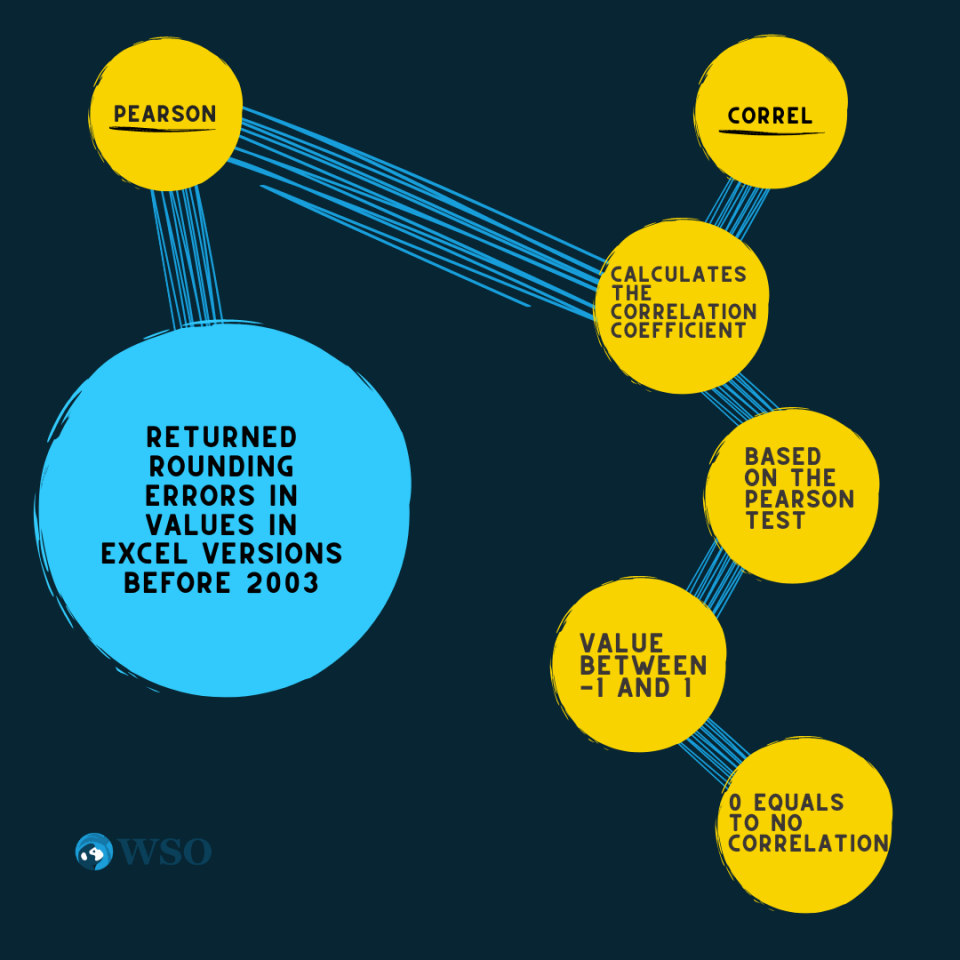
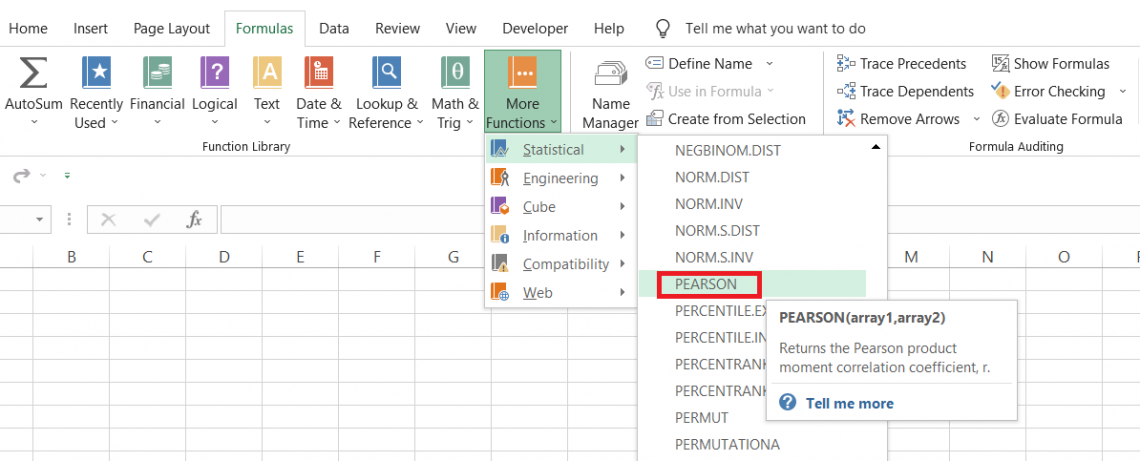
The function is an upgrade to the PEARSON function, which returns the correlation coefficient based on the dataset of two variables. The only difference between both functions is that the latter ‘sometimes’ showed rounding-off errors.
The term ‘correlation coefficient’ is based on the Pearson correlation test, which determines the strength and direction of the variables giving the output to the user in the range of -1 to 1.
A value of -1 indicates a perfect negative correlation, while a value of +1 indicates a perfect positive correlation. However, in practice, finding associations with perfect positive or negative correlations is quite difficult.
If the value equals zero, then the variables have no association.
The syntax for the function is
=CORREL(array1, array2)
where
- array1 - (required) collection/set of independent values
- array2 - (required) collection/set of dependent values
Note
The function ignores logical or text values supplied as a part of the array. If the lengths of array1 and array2 are different, you may get an #N/A Error.

Pearson Correlation Test
As stated earlier, a Pearson correlation test determines the strength and direction of the two variables and gives the result in the form of the Pearson correlation coefficient.
a. Positive Correlation
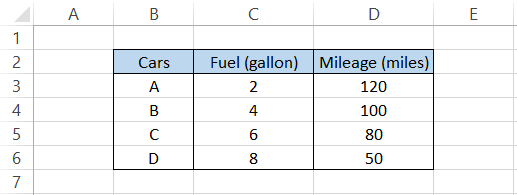
Let’s look at an example to understand the correlation test better. Suppose you have the fuel as an independent variable and mileage as a dependent variable, as illustrated below:

By representing the fuel on the X-axis and mileage on the Y-axis, our scatter plot looks as follows:
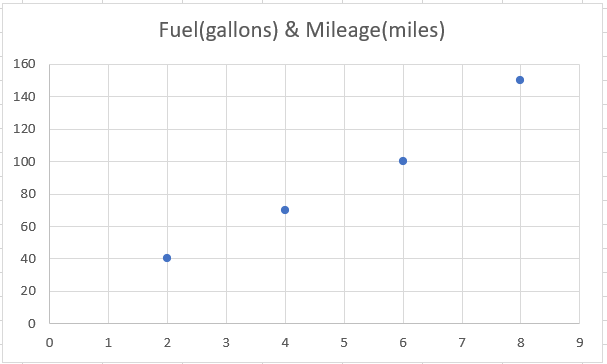
As you can see, our scatter plot is almost linear, i.e., a line can be drawn through all the points on the graph. Therefore, this exhibits a linear relationship between both variables using a straight line.
Since our straight line is moving in an upward direction, we say that there is a positive correlation between both variables, i.e., the value of the correlation coefficient is inclined towards +1.
When we use the CORREL function for this dataset, we get the value of 0.990867, meaning that both variables are ‘almost’ perfectly correlated.
b. Negative Correlation:
You can imagine a negative correlation if a straight line in an upward direction means a positive one.
Suppose you have the data as illustrated below:
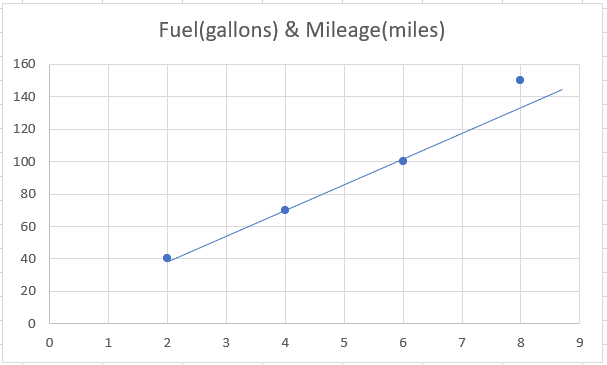
The scatter plot for the data would look as below:
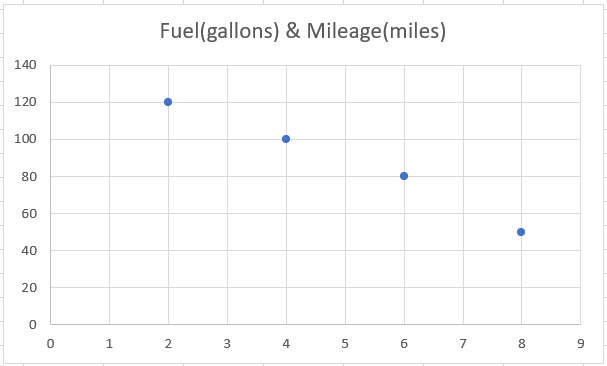
We see a downward trend in our dataset formed due to the intersection between the fuel on the X-axis and mileage on the Y-axis. When we draw a straight line through the points, we get
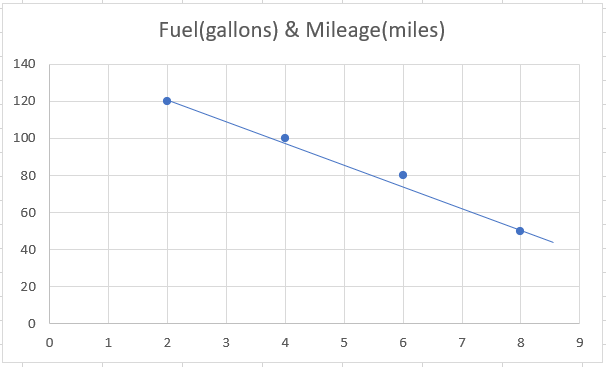
A downward straight line indicates negative correction, which, if calculated using the CORREL function, gives the value of -0.994376.
The value for the correlation coefficient would always lie between -1 and 1, most probably as a decimal number and quite ‘rarely’ as an integer on either extreme side.
c. Zero Correlation
If an upward and downward straight line indicates a positive and negative correlation, then what does zero correlation mean?
When a straight line cannot be drawn through the points on a scatter plot, it indicates zero correlation.
For example, suppose you have the data below:
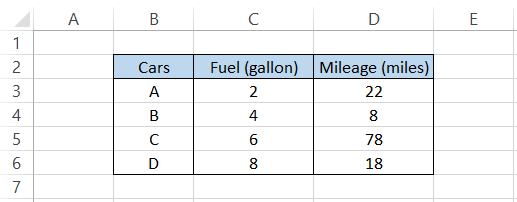
The scatter plot for the given data would be as illustrated below:
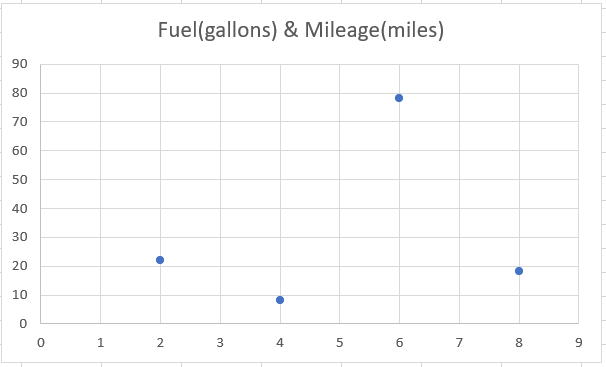
All the points are randomly scattered on the plot, and potentially no line passes through more than two points. Thus, there is no correlation between the datasets, which is confirmed when we use the CORREL function to give the value of 0.237298.
As stated earlier, getting the coefficient values as -1, +1, or 0 is quite difficult. As the values returned are in decimals, we can interpret them by applying certain cutoff limits to the values to describe the strength of the correlation.
For example, if the value falls between 0.00-0.10, it represents no correlation, while a value between 0.90-1.00 indicates a powerful positive correlation between the variables.
Note
The closer the data points are toward the linear relationship, the stronger the correlation between the variables.
Correlation Coefficient formula
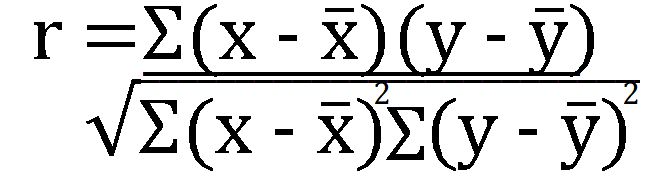
How would you calculate the correlation coefficient if neither the CORREL nor PEARSON functions existed in Excel?
In this case, we would have to use the below formula where x and y are the mean of the two arrays of values.
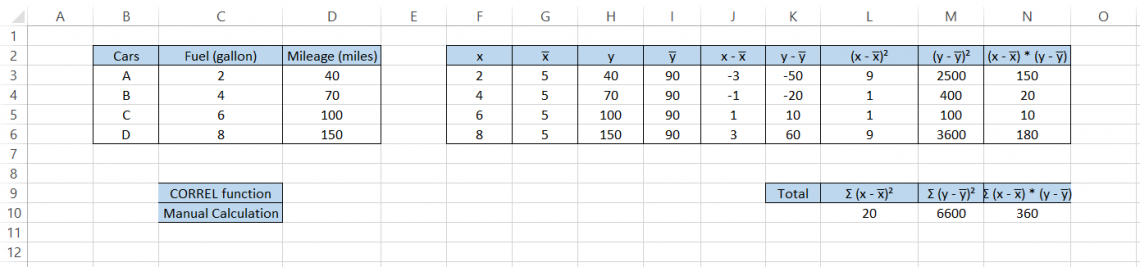
Let’s calculate the coefficient value manually to see what goes behind the scenes for the CORREL function. Let’s assume our data of four different cars with mileage per gallon of fuel as

First, we will calculate all the separate components from the formula in the table below:
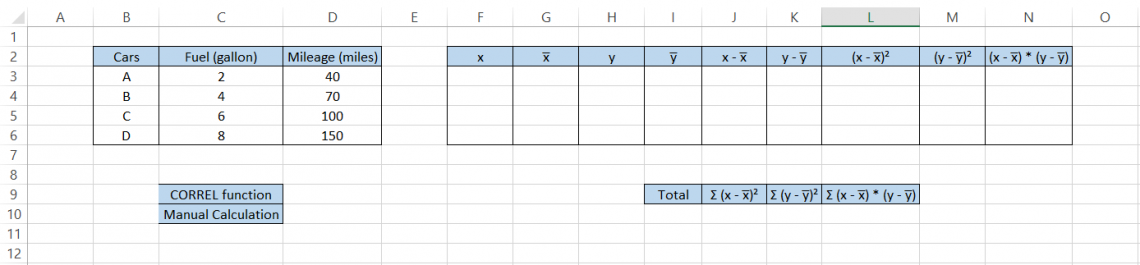
The steps that we need to follow are:
- Reference the values for fuel and mileage in the F and H columns, respectively.
- Calculate the mean value for fuel and mileage using the AVERAGE function, which gives the average fuel (gallon) as five and mileage (miles) as 90, respectively.
- Next, we subtract the value of x from its mean x and y from its mean y in the J and K columns.
- Then, we calculate the square of (x - x̅) and (y - y̅) by using the formula =POWER(J3,2) and =POWER(K3,2) in columns L and M.
- Finally, we multiply the equations (x - x̅)² and (y - y̅)² in column N. The calculations so far look, as illustrated below:
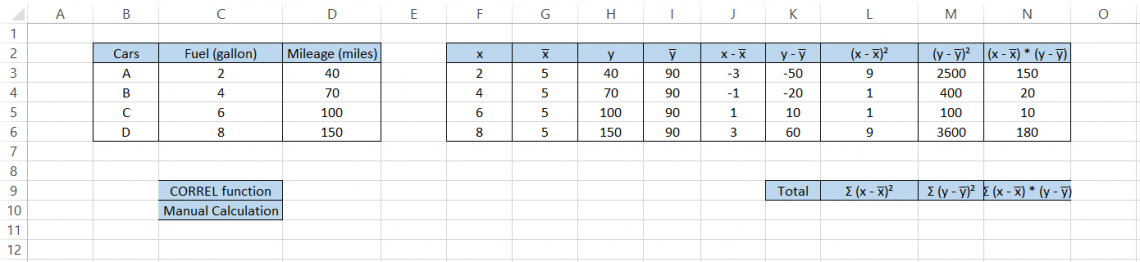
Now, all that’s left to do is calculate the sum of (x - x̅)², (y - y̅)², and (x - x̅)² * (y - y̅)² in cell L10, M10, and N10 respectively.
We will use the formula =SUM(L3:L6) in cell L10 and drag it to the right, which gives the result as
If we calculate the correlation coefficient using the CORREL function, we get the result as 0.990867389 in cell D9.
On the other hand, when we substitute all the values into =N10/(SQRT(L10*M10)), which is a simplified version of the coefficient correlation formula, we get:
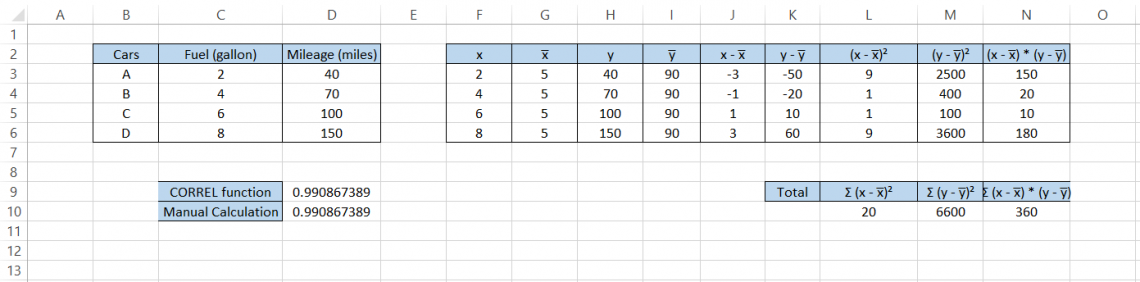
In both instances, the result is equal to 0.990867389. Thus, you can use either of the two methods, but we surely know that you might prefer using the CORREL function.
Example of CORREL function
Finally, we see how to use the function in the spreadsheet. It’s not that difficult, and you just need to reference the array of values for both variables.
Suppose we have the age and income data, as illustrated below:
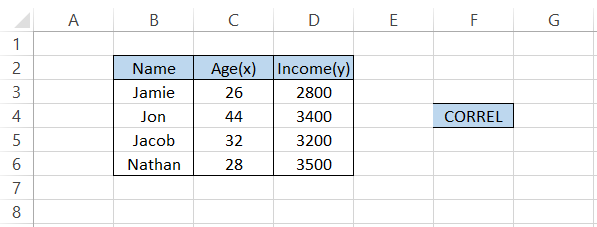
To get the correlation coefficient for the data, we will use the formula =CORREL(C3:C6, D3:D6), which gives the result of 0.474124.
Wasn’t that simple? Now that you know how easy it is to use the function, would you go through all those manual calculations?
We believe not. But yes, now you know both methods and how to calculate the coefficient. If you do not have access to the spreadsheet tool and need to make such calculations, you can even use a piece of paper to find the correlation coefficient.
Let’s see another example of calculating the coefficient using the CORREL function. Suppose you prepare the three-statement model for Nike Inc for the financial year end of 2019.
You project the Revenue and Taxes Paid as illustrated below:
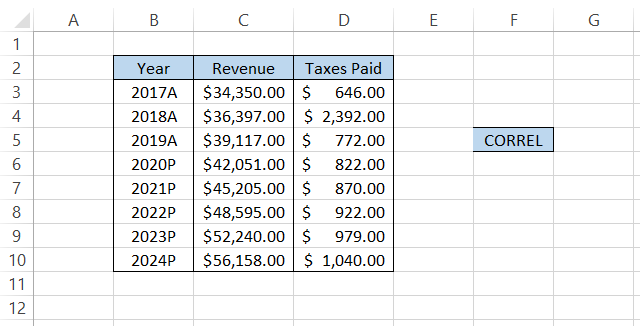
By using the formula =CORREL(C3:C10, D3:D10) in cell G5, we get the result as -0.20155, implying a negative correlation between the two variables.
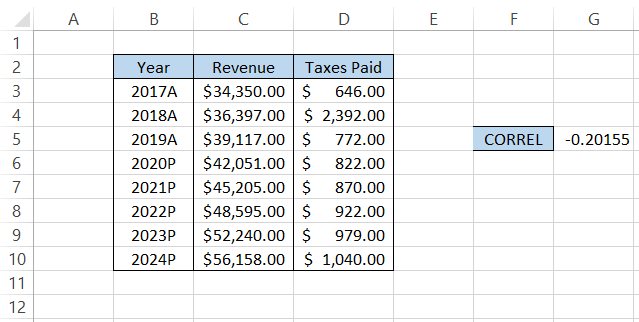
The taxes paid do not grow linearly with the Revenue. This means that NIke Inc has been utilizing its assets and liabilities with some efficiency so that taxes do not grow linearly with an increase in Revenue.
If you do not need recurring digits in the decimal number, you can use the ROUND function that limits the number to a specified number of digits after the decimal.
CORREL vs. PEARSON
Throughout the article, we had several mentions about how the correlation coefficient is derived from Pearson’s test and that there is a function called PEARSON in Excel, which also calculates the correlation coefficient r.
The PEARSON is categorized as a Statistical function that returns the correlation coefficient for two variables represented by continuous data from a random population.
There isn’t much difference between the functions. PEARSON has a similar syntax and returns the same result as CORREL. The only drawback with PEARSON was that it gave rounding errors in Excel versions before 2003.
However, the latest Excel versions have upgraded their calculation algorithms, so you can now use either function to calculate the correlation between two variables.
The syntax for the PEARSON function is
=PEARSON(array1, array2)
where
- array1 - (required) collection/set of independent values
- array2 - (required) collection/set of dependent values
Note
When logical or text values are supplied as a part of the array, they are ignored by the function. If the lengths of array1 and array2 are different, then the function returns the #N/A error.
Let’s see whether we get the same values for the correlation coefficient using both functions. Suppose you have the data for two variables, as illustrated below:
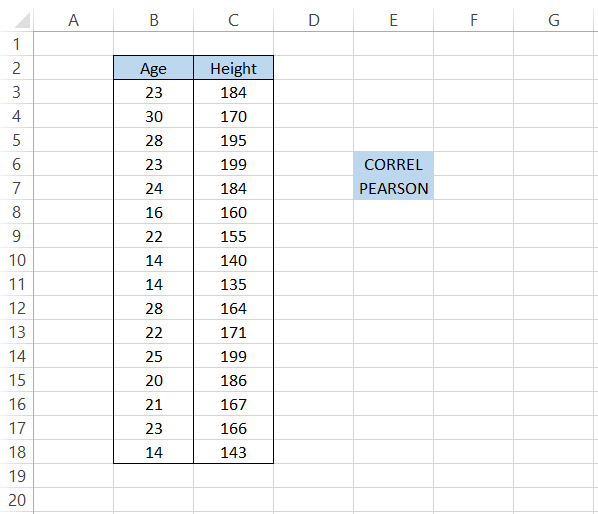
To calculate the correlation using the CORREL function, we will use the formula =CORREL(B3:B18, C3:C18) in cell F6, which gives the result 0.671095.
Similarly, we will use the formula =PEARSON(B3:B18, C3:C18) in cell F7, which also gives the result of 0.671095.
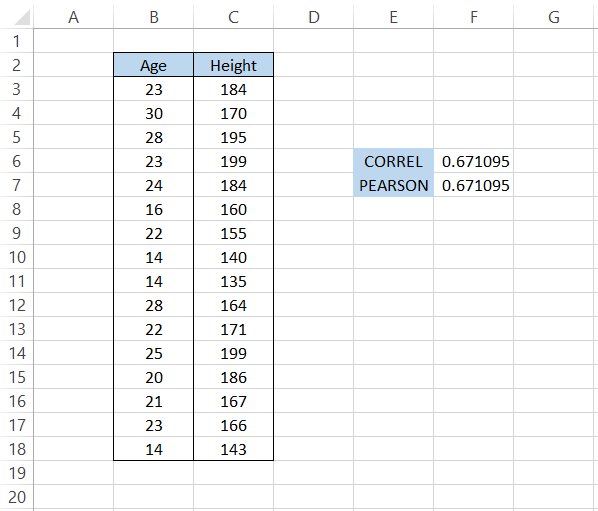
As you see, either function yields a similar result, providing us with flexibility regarding what function can be used in Excel.
Let’s see another example to understand the correlation between the price of Tesla Inc and the S&P 500 in the past few days. The data looks as illustrated below:
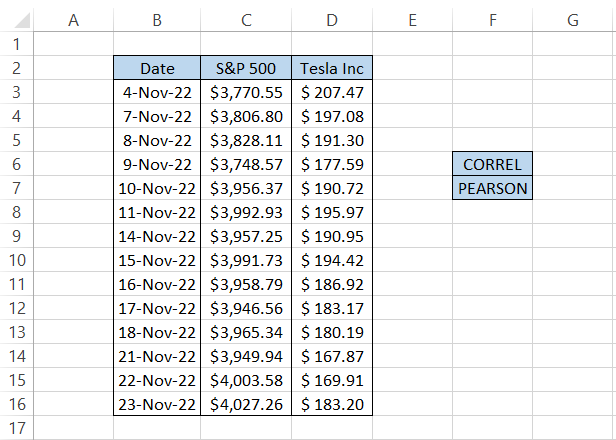
We will use the formula =CORREL(C3:C16, D3:D16) in cell G6 and =PEARSON(C3:C16, D3:D16) in cell G7, which gives the result -0.33484.
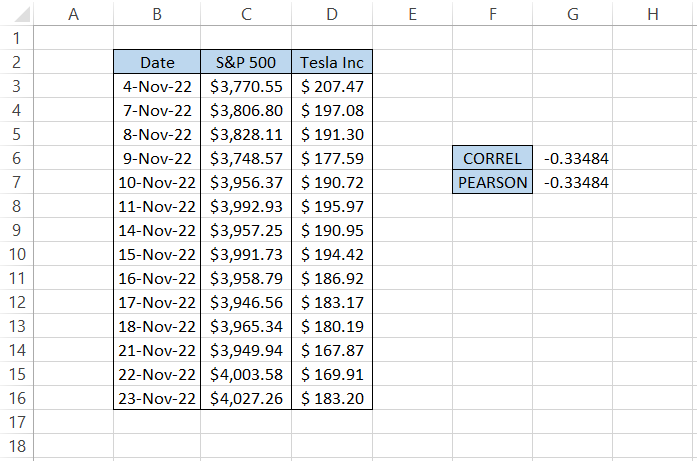
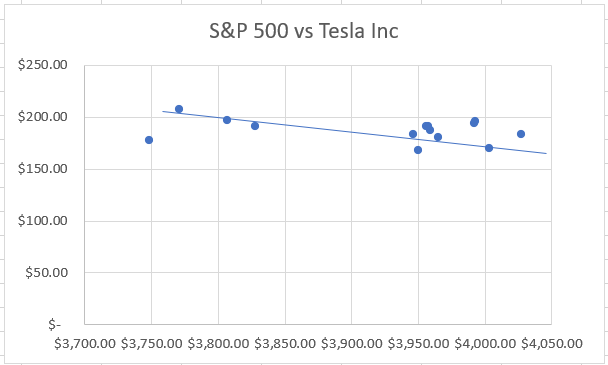
We see that the price of the S&P 500 and that of Tesla Inc have a weak negative correlation. From a general trend from 4th November 2022 to 23rd November 2022, we see that the price of the S&P 500 is increasing. However, that of Tesla Inc has been steadily falling.
Thus, the correlation graph for the dataset would be a downward straight line, as illustrated below:

Free Resources
To continue learning and advancing your career, check out these additional helpful WSO resources:


or Want to Sign up with your social account?