BINOM.DIST Function
A statistical function that calculates the probability of a certain number of successes in a fixed number of independent trials, each with the same probability of success.


What is Binomial Distribution in Excel?
The binomial distribution function, denoted as BINOM.DIST in Excel, is used to predict the probability of a given number of trials succeeding in an experiment. There are two outcomes when using a binomial distribution, success or failure, hence the name “binomial.”
Swiss mathematician Jacob Bernoulli proved the Bernoulli Expression, the precursor to our current binomial distribution. However, he was not the first to work with this idea, as Blaise Pascal, a French mathematician, explored binomial expressions much earlier.
This function has implications across many fields but is most often found in science, specifically in labs. When scientists are testing a drug's efficacy, they may use a binomial distribution to help determine if the success rates are strong enough.
But, when learning about the distribution, we often use more simple examples like the outcomes of flipping a coin or rolling a die. In this article, we will explore binomial distributions through these basic examples.
-
In a binomial scenario, each trial results in one of two outcomes: success or failure. There is no middle ground or intermediate outcome.
-
The binomial distribution is applicable when there are only two possible outcomes for each trial, such as yes/no, heads/tails, or success/failure.
-
The number of trials in a binomial distribution is predetermined and remains constant throughout the experiment.
-
The probability of success (and failure) remains constant for each trial in a binomial distribution.
Math Behind Binomial Distribution
In statistics, the binomial distribution is used to predict the chance that a certain number of successes occur, given the probability of the success occurring once.
There are a few things to check before using this:
1. Each trial has only one outcome
Each trial can either fail or succeed; there is no middle ground. For example, when blindly picking candies from a red and yellow jelly bean bag, there is no option for selecting a blue jelly bean.
The outcomes of a binomial distribution are called either success or failure.
You might question how this applies to the previous example of selecting red and yellow candies. You have to choose which color is the success. You may arbitrarily assign red as the success and yellow as the failure, or vice versa.
2. Each trial has the same probability of success.
When using a binomial distribution to calculate probabilities, one of the necessary components is the probability of success. The probability must be the same for each trial to ensure true accuracy.
For example, when flipping a fair coin, there is always a 50% chance of heads and a 50% chance for tails.
3. Each trial is mutually exclusive of the others.
This means that the result of one trial does not affect the results of the others.
Note
When flipping a coin, getting “heads” in one trial does not influence whether or not “heads” will be the outcome in the subsequent trials; if you flip the coin sufficiently, you will find there is a 50% chance of getting heads and 50% chance of getting tails.
This is important as it ties into the second point, discussing how each trial has the same probability of success. If the trials were not mutually exclusive, the possibility would not be consistent throughout, as it would change depending on the results of previous tests.
4. The number of total trials is fixed.
This rule is essential because part of the binomial probability function asks for the total number of trials. You will get inaccurate results if this number is variable within an experiment.
For example, if your experiment involves flipping a coin and you decide to flip the coin 15 times, you cannot change this total number throughout the experiment.
Binomial Mass Probability Function
Statistics uses a precise formula to calculate probabilities through a binomial distribution. It is as follows:
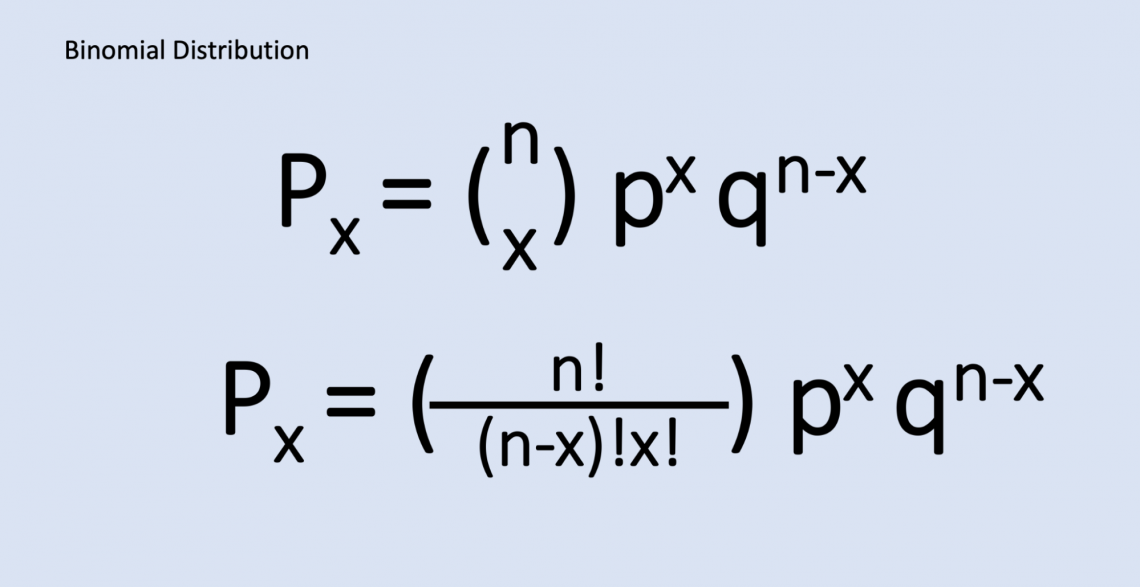
Where
- n is the total number of trials
- x is the number of successes
- p is the probability of success in a trial
- q is the probability of failure in a trial (q=1-p).
Both formulas shown have the same meaning; the first formula shows the shorthand way of writing it, and the second shows the longer form.
Excel’s BINOM.DIST function runs by using this formula. However, the syntax of the formula is different, as Excel uses a command, which is:
BINOM.DIST(number_s,trials,probability_s,cumulative)
- number_s (required): the number of successes in the trial. This is “x” from the mathematical formula
- trials (required): the total number of trials in the experiment. This is “n” from the mathematical formula.
- probability_s (required): the probability of success for a trial. This is “p” from the mathematical formula.
- Cumulative (required): either “TRUE” or “FALSE” is inputted.
- TRUE indicates that you are looking for the probability of at most number_s successes occurring. This is a cumulative distribution function.
- FALSE indicates that you are looking for the probability of exactly number_s successes occurring. This is a probability distribution function.
The formula for Binomial Distribution
You are rolling a standard fair die and want to know the probability of getting four 3s out of ten rolls.
First, let's understand why it would be appropriate to use a binomial distribution here.
- Each trial has only one outcome; either the test is a success (roll a 3) or a failure (did not roll a 3).
- Each trial has the same probability for success; the probability for success is ⅙ each time because you are using a die with only one 3.
- Each trial’s outcome is mutually exclusive of the others; rolling a 3 in this trial does not impact the chance of moving a 3 in the subsequent trial.
- The total number of trials is fixed; the question asks for ten rolls, which will not change throughout the experiment.
Now that we have confirmed that the problem conforms to the rules of a binomial distribution, we can determine what numbers to use and plug them into the function.
- n = ten total trials
- x = four successes
- p = ⅙ chance of rolling a 3 in a trial
- q = 1-⅙ = ⅚ chance of not moving a 3 in a trial
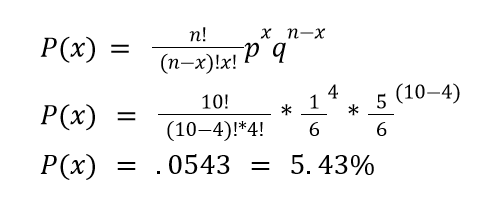
This means there is a 5.43% chance of rolling four 3s in ten rolls of a fair die.
But what if we wanted to know the probability of having at most four 3s rolled? We would add up the possibility of moving 3, four times, three times, two times, one time, and zero times.
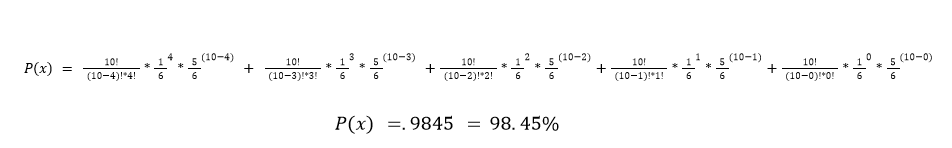
This means there is a 98.45% chance of rolling at most four 3s in ten rolls of a fair die.
Calculating the probability of rolling three exactly four times was fairly simple (probability distribution function), but calculating the probability of rolling three a range of times was tedious (cumulative distribution function).
NOTE
Using a program like Excel can help make the calculating process easier.
How to Use the Binomial Distribution Function in Excel?
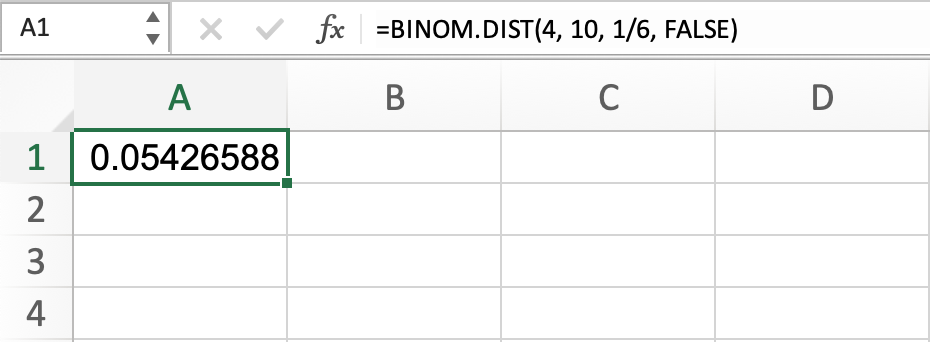
Let's look at the same example used when calculating probabilities by hand. As a refresher, you are rolling a standard die ten times and want to know the probability of rolling a 3 EXACTLY four times out of ten rolls.
We simply need to input a value for each formula part to solve this in Excel.
BINOM.DIST(number_s,trials,probability_s,cumulative)
- number_s = 4 successful trials
- trials = 10 total trials
- probability_s = ⅙ chance of success per trial
- cumulative = FALSE
Altogether, this reads BINOM.DIST(4, 10, ⅙, FALSE). When inputted into Excel, it is found that the chance of rolling a three exactly four times out of ten is .0543, or 5.43%. This is the same value we found when we did the math by hand.
By modifying this formula, we can also find the probability of NOT rolling three or four times out of ten rolls. The only chance we need to do is subtract the entire quantity by 1, which will look like this:
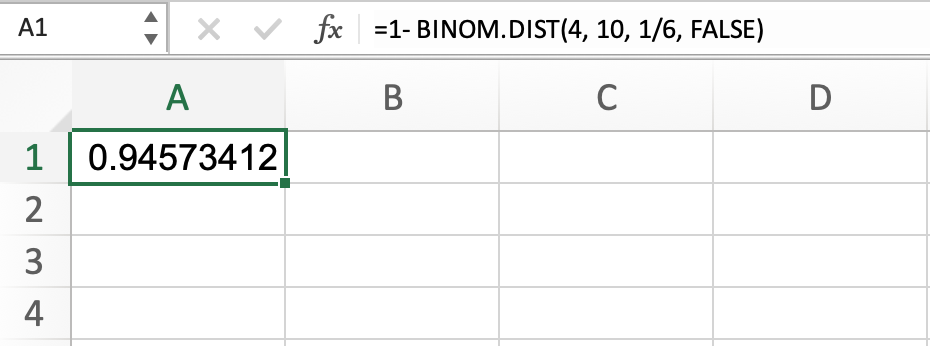
This indicates a 94.57% chance of not rolling three precisely four times the ten rolls.
But what if you were looking for the chance to roll a 3 AT MOST four times the ten rolls?
You could use the formula we used to find rolling a 3 EXACTLY four times, but change “FALSE” to “TRUE.” This change indicates you are looking for a range of probabilities, and the formula and output would read:
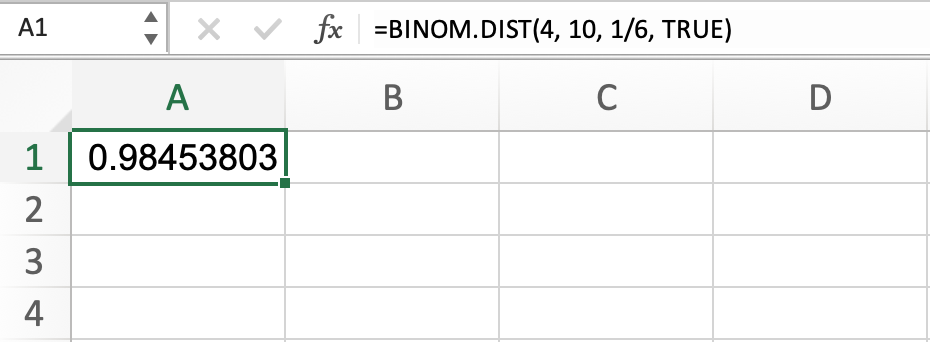
This indicates a 98.45% chance of rolling a three at most four times of the ten rolls.
Similarly, we can use a near-identical function to determine the probability of rolling a 3 AT LEAST four times of ten rolls. This would be calculated by subtracting the cumulative distribution function from 1.
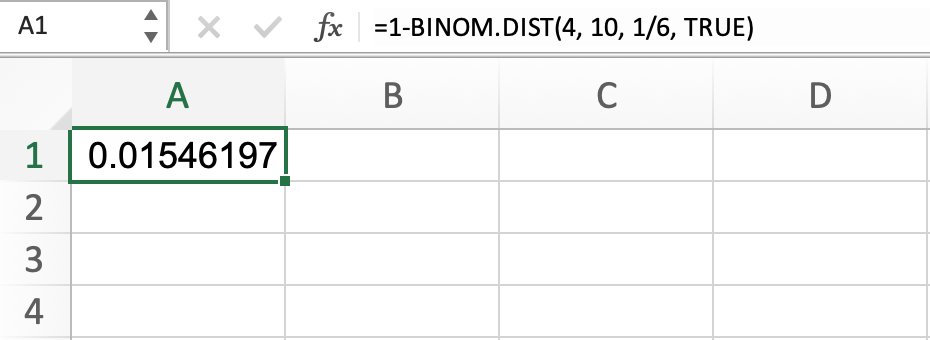
This result indicates a 1.55% chance of rolling three at least four times the ten rolls.
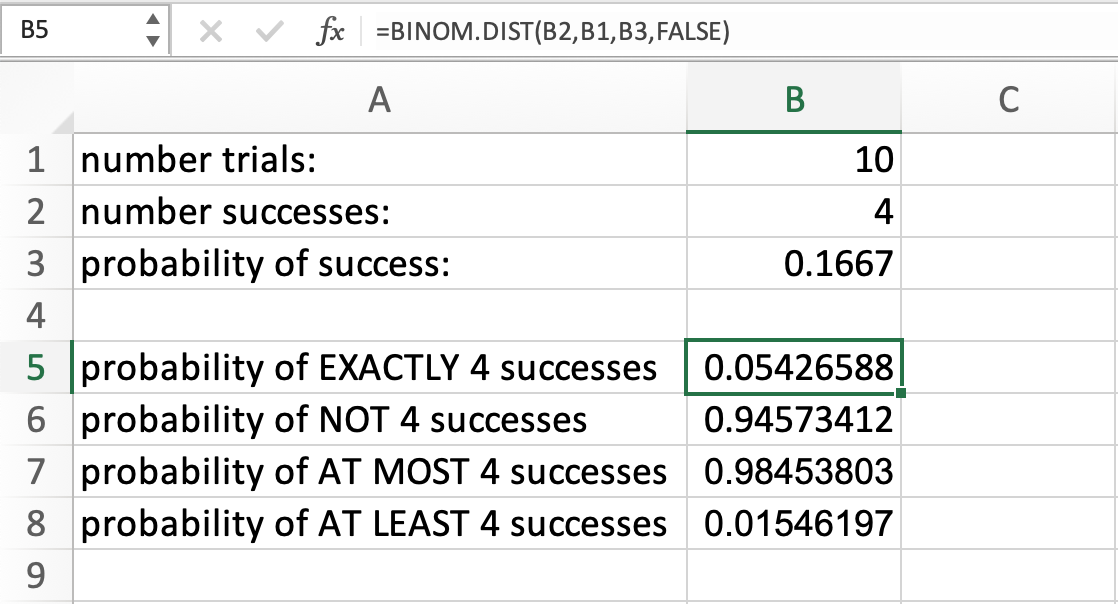
While all the examples above do not use cell references for number_s, trials, or probability_s, cell references can be used. Below, we can see the calculations of all the situations above, but this time using cell references:
Conclusion
A foundational idea in probability theory, the binomial distribution offers a framework for examining scenarios with binary outcomes. Its importance is shown in a variety of domains, such as biology and finance, where knowing the probability of particular occurrences happening is essential.
The binomial distribution helps with risk assessment, hypothesis testing, and decision-making by describing the likelihood of achieving a specific number of successes in a predetermined number of trials. Its continued significance in statistical analysis is highlighted by its ease of use and practical application.
The binomial distribution is a useful tool for estimating uncertainty and helping with decision-making, whether it is used for marketing campaign success rates, manufacturing process reliability, or genetic inheritance patterns.
Gaining an understanding of the principles and uses of the binomial distribution gives people important analytical abilities that enable them to confidently and accurately negotiate unpredictable circumstances.

Free Resources
To continue learning and advancing your career, check out these additional helpful WSO resources:


or Want to Sign up with your social account?