F.DIST Function
An Excel Statistical function used to calculate continuous probabilities, critical values, and statistical tests in hypothesis testing.


What Is The F.DIST (F-Distribution) Function?
The F.DIST function is an Excel Statistical function used to calculate continuous probabilities, critical values, and statistical tests in hypothesis testing. It is a fundamental tool in statistical analysis and decision-making.
F-distribution arises from the ratio of two independent chi-square distributions, each divided by the degree of freedom. The parameters of this distribution determine its shape and behavior.
Among these distributions, the F-distribution holds significant importance, particularly in hypothesis testing, analysis of variance (ANOVA), and regression analysis.
Excel provides a powerful tool called the FDIST function, which allows users to calculate the cumulative probability associated with the F-distribution.
The FDIST function in Excel makes it easier to compute cumulative probabilities associated with the F-distribution.
The F-distribution is a continuous probability distribution that arises from the ratio of two independent chi-square distributions. Its parameters determine its shape and behavior.
Comprehending the F-distribution is essential for performing various statistical tests and making sound judgments based on the underlying data. The FDIST function in Excel makes it easier to compute cumulative probabilities associated with the F-distribution.
By providing the proper inputs, such as the value at which the cumulative probability is evaluated and the degrees of freedom, users may gain significant insights into the possibility of witnessing various F-values or test statistics.
This information aids in hypothesis testing, where researchers compare observed F-values to critical values to determine the statistical significance of their findings.
By understanding the F-distribution and harnessing the power of the FDIST function, researchers can enhance their statistical analyses and make informed decisions based on robust data-driven evidence.
- The F.DIST function returns the F probability distribution, which helps compare the degree of variability between two data sets. It is often used in analysthe is of variance (ANOVA).
- In hypothesis testing, the result from the F.DIST function is compared to a significance level (α) to determine the statistical significance of a test statistic.
- The F.DIST function calculates the cumulative probability from the left tail of the F-distribution. To obtain the probability from the right tail, subtract the result from 1 or use the complementary F-distribution function (1 - F.DIST).
- Understanding and utilizing the F.DIST function in Excel empowers researchers and analysts to perform statistical analysis, make informed decisions based on significance testing, and draw reliable conclusions from data.
Understanding the F-Distribution
The F-distribution is essential for statistical analysis, particularly in hypothesis testing, ANOVA, and regression analysis. It was developed by the statistician Ronald Fisher as part of his contributions to experimental design and inference.
The F-distribution arises from the ratio of two independent chi-square distributions, each divided by their respective degrees of freedom. These degrees of freedom represent the number of independent information available for estimation.
It is always positive and skewed to the right. As the degrees of freedom increase, the F-distribution becomes more symmetrical and approaches a normal distribution. There are numerous applications of the F-distribution in statistical analysis.
One primary application is in ANOVA, which compares the variances of two or more groups. In regression analysis, the F-distribution is employed to test the overall significance of a regression model.
Furthermore, the F-distribution uses quality control processes to evaluate the variability in manufacturing or production processes. It helps analysts determine if there are significant differences in the variability between different production batches or equipment.
Understanding the F-distribution is crucial for conducting statistical tests, interpreting results, and making informed, data-based decisions.
It provides a framework for assessing the significance of observed differences, evaluating regression models, and ensuring quality control.
By utilizing appropriate statistical techniques and functions, such as the FDIST function in Excel, researchers can effectively harness the power of the F-distribution in their analyses and draw reliable conclusions from their data.
Using the FDIST Function in Excel
Excel provides the FDIST function as a powerful tool to calculate the cumulative probability associated with the F-distribution. Understanding how to use the FDIST function can greatly assist in statistical analysis.
The syntax for the function is:
=FDIST(x, degrees_freedom1, degrees_freedom2)
Where:
- x: The value at which you want to evaluate the cumulative probability of the F-distribution.
- Degrees_freedom1: The degrees of freedom for the numerator of the F-distribution.
- Degrees_freedom2: The degrees of freedom for the denominator of the F-distribution.
Note
The FDIST function in Excel calculates the cumulative probability from the left tail of the F-distribution. If you need the probability from the right tail, subtract the result from 1 or use the complementary F-distribution function (1 - FDIST).
Using the FDIST function in Excel, you can easily obtain the cumulative probability associated with the F-distribution at specific values.
This information is valuable in hypothesis testing, analyzing ANOVA results, and making informed decisions based on the statistical significance of test statistics. Excel's functionality simplifies these calculations and enhances the efficiency of statistical analysis.
Example of F Dist Function Distribution
Let us take a look at a hypothetical example of how to calculate F Dist Function Distribution in Excel!

Suppose we have the following values for our calculation:
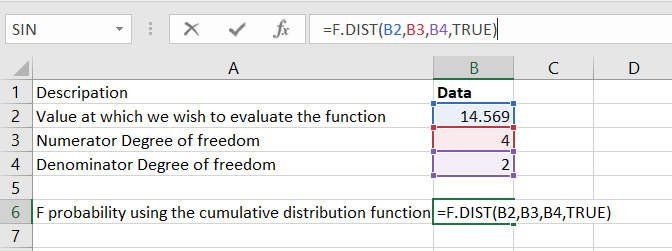
- Value at which we wish to evaluate the function: 14.569
- Numerator degree of freedom: 4
- Denominator degree of freedom: 2
Step 1: To find out the F probability using the cumulative distribution function, which is the TRUE cumulative argument, we will use the following formula:
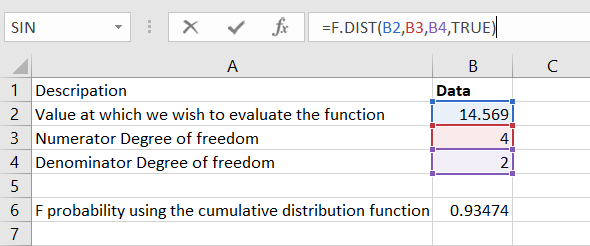
Step 2: We get the result below:
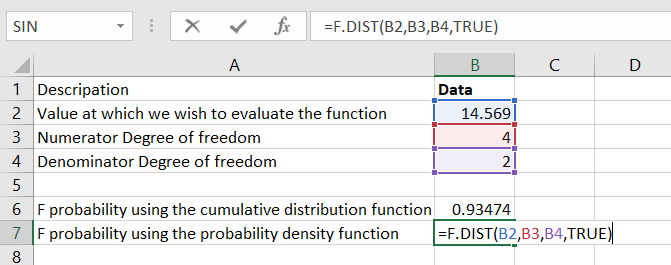
Step 3: To find out the F probability using the probability density function, which is the FALSE cumulative argument, we will use the following formula:
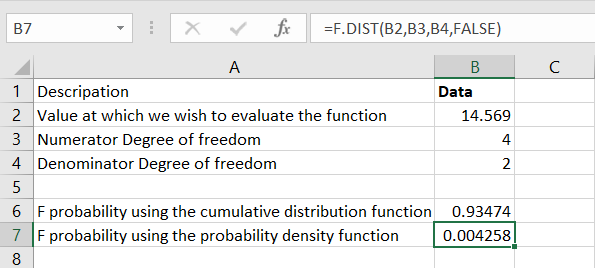
Step 4: We get the result below:
We cannot give you the exact calculations or the final solution without the specific data and formulae used in your example. However, you can follow the steps outlined above using your data and formulas in Excel to calculate the F-distribution.
The FDIST function calculates the F probability of the right-tailed distribution for two tests. This function is outdated and is replaced with the F.DIST and F.DIST.RT function, which was introduced in Excel 2010.
Applications of the F-Distribution
The F-distribution has several important applications in statistical analysis.
Here are some key applications:
1. Analysis of Variance (ANOVA)
One of the primary uses of the F-distribution is in ANOVA. ANOVA compares the means of two or more groups to determine whether they have statistically significant differences.
If the calculated F-value is sufficiently large, it suggests that there are significant differences between at least some of the groups.
2. Regression Analysis
The F-distribution is also employed in regression analysis to assess the overall significance of a regression model. A significant F-value indicates that the whole regression model provides valuable information and is not due to random chance.
3. Quality Control
The F-distribution finds application in quality control processes, particularly in assessing the variability of production or manufacturing processes.
Note
By comparing the variances of different production batches or equipment, analysts can determine whether there are statistically significant differences in variability. This helps identify sources of variation and ensure consistent quality in the manufacturing process.
4. Experimental Design
The F-distribution is extensively used in experimental design to evaluate the significance of treatment effects. By conducting F-tests, researchers can make informed decisions about the effectiveness of experimental treatments.
5. Statistical Hypothesis Testing
The F-distribution is employed in various statistical hypothesis tests where the test statistic follows an F-distribution.
Note
When comparing the variances of two populations, such as in the F-test for equality of variances, the F-distribution is used to determine the critical value and p-value for hypothesis testing.
Understanding the applications of the F-distribution enables researchers and analysts to choose appropriate statistical tests, interpret results accurately, and make informed decisions based on the underlying data.
By leveraging the properties of the F-distribution and employing the appropriate statistical techniques, researchers can gain valuable insights into their data and draw reliable conclusions.
Interpreting the Result
Interpreting the result obtained from the FDIST function in Excel is crucial for understanding the cumulative probability associated with the F-distribution.

The result of the FDIST function is a decimal value between 0 and 1, representing the cumulative probability associated with the F-distribution. This probability indicates the likelihood of observing a value less than or equal to the specified x-value.
Interpretation depends on the context of your analysis:
Hypothesis Testing
In hypothesis testing, the result from the FDIST function is compared to a significance level (usually denoted as α) to determine the statistical significance of a test statistic.
If the obtained cumulative probability is less than or equal to α, it suggests that the observed result is statistically significant, and you reject the null hypothesis in favor of the alternative hypothesis.
Confidence Intervals
The cumulative probability obtained from the FDIST function can be used to construct confidence intervals in statistical estimation. Confidence intervals provide a range of plausible values for a population parameter.
Note
The cumulative probability helps determine the level of confidence associated with the estimated interval. For example, a 95% confidence interval corresponds to a cumulative probability of 0.95.
ANOVA And Regression Analysis
In ANOVA and regression analysis, the cumulative probability obtained from the FDIST function can be used to assess the statistical significance of the F-statistic.
You can determine if the observed result is statistically significant by comparing the calculated F-value to the critical F-value obtained from tables or statistical software.
If the calculated cumulative probability is smaller than the significance level (p ≤ α), it suggests evidence of a significant effect or relationship.
The FDIST function in Excel calculates the cumulative probability from the left tail of the F-distribution. If you require the probability from the right tail, subtract the result from 1 or use the complementary F-distribution function (1 - FDIST).
By appropriately interpreting the result obtained from the FDIST function, you can make informed decisions about the statistical significance of your findings and draw meaningful conclusions from your data.
F.DIST (F-Distribution) Function FAQs

The F-distribution is a probability distribution that arises from the ratio of two independent chi-square distributions. It is used in statistical analysis, particularly hypothesis testing, ANOVA, and regression analysis.
The F-distribution represents the distribution of F-statistics calculated in various statistical tests. It describes the variability between groups or models relative to the variability within groups or models.
The F-distribution is positively skewed and defined for positive values only. It is influenced by two sets of degrees of freedom: degrees of freedom for the numerator (df₁) and degrees of freedom for the denominator (df₂).
The F-distribution is used in hypothesis testing, analysis of variance (ANOVA), regression analysis, quality control, and experimental design. It helps assess statistical significance, compare variances, and evaluate treatment effects.
Excel provides the FDIST function to calculate the cumulative probability. Use the syntax: =FDIST(x, degrees_freedom1, degrees_freedom2), where x is the value at which you want to evaluate the probability and degrees_freedom1 and degrees_freedom2 are the degrees of freedom.
The result from the FDIST function is a decimal value between 0 and 1, representing the cumulative probability. It indicates the likelihood of observing a value less than or equal to the specified x-value in the F-distribution.
In hypothesis testing, compare the calculated cumulative probability with a significance level (α).
The FDIST function in Excel calculates probabilities from the left tail. To obtain probabilities from the right tail, subtract the result from 1 or use the complementary F-distribution function (1 - FDIST).
No, the F-distribution assumes normality and is primarily used for parametric data analysis. Non-parametric data analysis requires different distributions and tests.
For specific cases, alternative distributions like the t-distribution or chi-square distribution may be used. These distributions have their applications and are utilized depending on the specific statistical test and assumptions.

Free Resources
To continue learning and advancing your career, check out these additional helpful WSO resources:


or Want to Sign up with your social account?