Excel Definition
A powerful data organizing, analysis, and manipulation tool developed by Microsoft.


What Is Microsoft Excel?
Microsoft Excel is a powerful data organizing, analysis, and manipulation tool developed by Microsoft. It is widely used in many fields, including business, banking, and academia, for budget creation, statistical data analysis, and project monitoring.
Excel organizes data into rows and columns in a grid-like structure known as a worksheet. Users may arrange cells and create charts and graphs to visually and meaningfully represent data in each spreadsheet cell.
Excel also has many built-in capabilities for processing, analyzing, and interpreting data. In addition to its extensive data analytic skills, it includes various features that make it simple to interact with people.
Excel allows users to build and manage lists and databases and share and collaborate on spreadsheets in real time.
It is a Microsoft Office component accessible for Windows, macOS, Android, and iOS. Excel is a powerful and commonly used application that may be useful in various situations.
- Microsoft Excel is a powerful spreadsheet program developed by Microsoft and is part of the Microsoft Office suite. It allows users to organize, analyze, and visualize data using features such as formulas, functions, charts, and tables.
- Excel provides a wide range of features to handle various data manipulation tasks, including data entry, calculation, formatting, and presentation. Users can create worksheets, workbooks, and templates to organize and store their data efficiently.
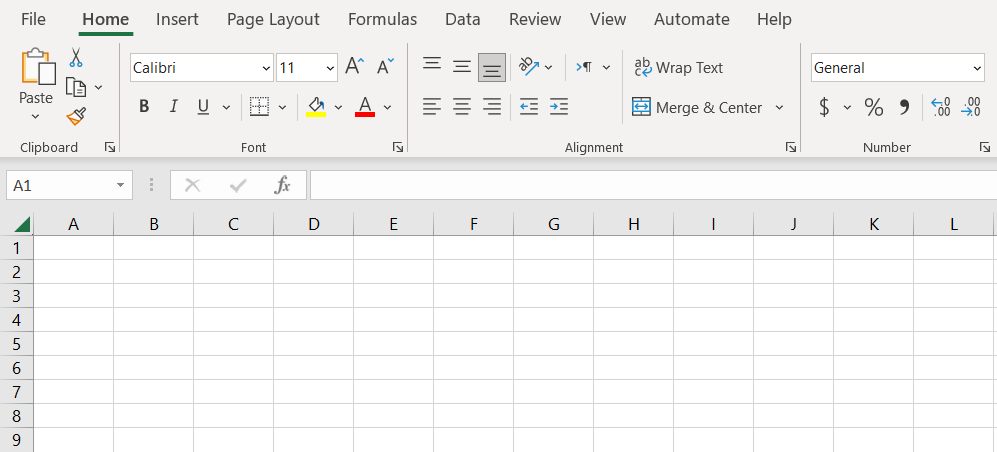
- Excel's user interface consists of a grid of cells organized into rows and columns, where users input and manipulate data.
- Excel offers powerful tools for data analysis and visualization, including sorting, filtering, conditional formatting, pivot tables, and pivot charts.
Excel Definition & Features: Data functions, formulas, and shortcuts
Excel uses a grid of cells arranged in numbered rows and letter-named columns to handle data manipulations such as arithmetic operations.
Its built-in functionalities address statistical, engineering, and financial requirements. Furthermore, it may display data in line graphs, histograms, and charts and a very restricted three-dimensional graphical presentation.
It uses pivot tables and the scenario manager to segment data and evaluate its reliance on numerous aspects from distinct viewpoints.
NOTE
A PivotTable is a data analysis tool that simplifies big data sets using PivotTable fields.
It has a programming component, Visual Basic for Applications, which allows the user to apply various numerical methods, such as solving differential equations in mathematical physics and then sending the results back to the spreadsheet.
VBA programming enables modification that would be difficult or impossible with traditional spreadsheet procedures. Programmers can create code directly in the Visual Basic Editor (VBE), which contains a window for writing and debugging code.
The user may lead the computation using any desired intermediate results sent back to the spreadsheet by implementing numerical techniques and automating chores such as formatting or data organization in VBA.
It also has several interactive capabilities that enable user interfaces that may fully hide the spreadsheet from the user, allowing the spreadsheet to portray itself as an application or decision support system (DSS) via a custom-designed user interface.
NOTE
It includes around 480 functions, and further functionality may be added via add-ins.
In a more complex implementation, an Excel program may poll external databases and measure equipment regularly using an updated schedule, analyze the results, generate a Word document or PowerPoint slide show, and e-mail these presentations to a list of participants.

Understanding Excel Terminology
It has its language for its components, which new users may need help comprehending.
Among these words and components are the following:
- Cell. A user inserts information into a cell formed by the intersection of a column and a row.
- Active cell. A green box shows the presently chosen cell.
- Cell reference. This is the set of coordinates at which a cell may be found. Rows are horizontal and numbered, whereas columns are vertical and lettered.
- Column and row headings. These are the cells with numbers and letters situated just outside the columns and rows. When you select a header, the entire row or column is highlighted.
- Worksheet. These are the many papers contained within a Workbook.
- Worksheet tab. These are the tabs on the spreadsheet's bottom left.
- Workbook. This is a file with one or more worksheets.
- Formula. Formulas are mathematical equations, cell references, or functions used to generate a value when placed inside a cell. Formulas must begin with an equal sign, "=".
- Formula bar. This is the lengthy input bar for entering values or formulas into cells. It's close to the "fx" label towards the top of the spreadsheet.
- Address bar. The number and letter coordinates of an active cell are displayed in this bar, placed to the left of the formula bar.
- Filter. These are the rules that a user can apply to determine which worksheet rows to show. This option may be found in the upper right corner of the home bar under "Sort & Filter." An auto filter option may be used to display rows that match specific values.
- AutoFill. This function allows users to copy data to several cells automatically. Users can choose two or more cells in a sequence and drag the bottom right corner down to autofill the remaining cells.
- AutoSum. Users can utilize this functionality to enter multiple values. Users can add cells by selecting them and pressing the Alt and Equal keys. On the top right of the home page, above "Fill" and to the left of "Sort & Filter," there is also a button to activate this option.
- PivotTable. This data summarizing tool automatically organizes and calculates data. This may be found on the far left under the insert tab.
- Source data. This is the data that is utilized to generate a Pivot Table.
- PivotChart. This graphic provides graph representations of the data to the PivotTable as a visual help. It's at the bottom of the insert page, close to the maps.
Where is Excel used?
It is mostly utilized in corporate contexts by small to large companies.
Its uses include:
- Business Analysis
- Strategic Analysis
- Financial Analysis
- Accounting and Bookkeeping
- Financial Modeling
- Operations Management
- Performance Reporting
- Administration
- People Management
- Anything really
1. Business Analysis
The most common application in the office is to analyze and improve business performance. Essentially, this is the use of obtained data to inform decision-making.
It is a usage in which corporate choices are intimately linked to data and calculations on spreadsheets. You use it to help you make decisions about investments and asset allocations.
3. Financial Analysis
It makes it simple to undertake financial analysis. It has various financial functions, such as the Payment function PMT and the Present Value Function PV, that allow you to arrive at financial analysis conclusions swiftly.
4. Accounting and Bookkeeping
Accountants and bookkeepers use it to do sophisticated calculations such as amortization tables and depreciation schedules.
It refers to methods for creating anticipated financial statements that estimate the company's financial success in a future period based on assumptions and past performance data.
6. Operations Management
Many organizations rely significantly on it to handle their day-to-day operations.
It is a valuable tool for many small companies (or parts of larger businesses). It is relatively low-tech, allowing it to be utilized by many individuals without the risk of programming flaws.
Business operations frequently entail intricate logistics. Inventory flows must be managed to keep operations functioning properly. This includes keeping track of supplier and customer transactions, creating a calendar of important events, and managing time and schedules.
7. Performance Reporting
Performance monitoring and reporting is a subset of corporate analysis that may be accomplished with it. Many accountants, for example, continue to use it, partly because it is compatible with cloud-based accounting software.
NOTE
A pivot table is a standard approach to transforming data into a performance report. Pivot tables have many built-in functions that enable operations such as counting and summing specific data inside the dataset.
8. Administration
Office administrators use it to enter and store important administrative data, which may be utilized for accounting and financial reporting, operations analysis, and performance reporting.
It is important in office administration to assist with day-to-day duties like invoicing, paying bills, contacting suppliers and clients, and recordkeeping. It's a multi-purpose program for tracking and organizing workplace operations.
9. People Management
A spreadsheet may also be used to manage information on individuals, whether they are workers, clients, supporters, or training participants.
Individual personal information may be conveniently saved and accessed. Individual records in a spreadsheet can include information such as
- name,
- email address,
- start date,
- things purchased,
- subscription status, and
- last contact.
10. Anything, Really!
A to-do list or task tracker has various purposes, from creating one with columns for assignments, deadlines, and achievements to keeping track of contact data with sections for names, addresses, phone numbers, and email addresses.
It may also be used to track expenditure or revenue, with columns for amounts, categories, and dates, as well as to create a timetable or calendar, with columns for days, appointments, and other events.
Another example is making a project plan or schedule with columns for tasks, dependencies, and deadlines.
These are only a few instances; your imagination only limits the possibilities. Excel is a very versatile tool that can be used to manage virtually any form of data.
Excel Accessibility: Mobile and Web
In addition to all the features and capabilities Excel has, its accessibility is one of the main reasons it is still widely used. Other Access from one’s computer or PC is accessible from mobile and the web.
1. Access from mobile
Excel Mobile is a spreadsheet software that supports the editing of XLSX files. It is capable of the following:
- editing and formatting text in cells,
- calculating formulae,
- searching inside the spreadsheet,
- sorting rows and columns, freezing panes,
- filtering columns,
- adding comments, and
- creating charts.
You can use OneDrive, Dropbox, or a team site to view Office files saved on your PC from your iPad, iPhone, Android smartphone, or Windows device. You may also send email attachments and open them on your mobile device.
NOTE
The Mobile version does not support protection settings, zoom settings, auto filter settings, some chart formatting, hidden sheets, and other features, which will be changed when you open and save a file.
2. Access from the web
Excel on the web is a free, lightweight version included with Office on the web, including web versions of Microsoft Word and PowerPoint.
The bulk of the desktop features and functions are shown and supported similarly in the Online version, and you won't notice a difference between the two for most data spreadsheet tasks. It is equally built and provides comparable tools for acquiring, analyzing, and displaying data.
NOTE
The Online version also supports collaboration and allows you to sync spreadsheets with other web programs.
Sharing an online spreadsheet with others lets everyone work on it simultaneously, inputting data, leaving comments, and more. You can check who is in the file and start a conversation with an in-document chat.
History and Future of Excel
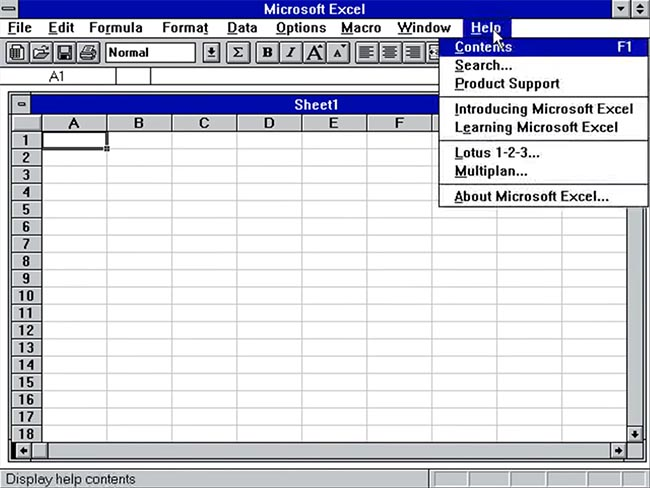
Microsoft first introduced it in 1985 as Microsoft Multiplan. At the time, Microsoft's spreadsheet application competed with similar offerings, such as Lotus 1-2-3 from Lotus Development Corp.
Although Lotus 1-2-3 is credited with being the first spreadsheet to include cell names and macros, Multiplan employed a graphical user interface that allowed users to point and click with a mouse. Multiplan simplified the manipulation, processing, and viewing of spreadsheet data.
When competing with Lotus 1-2-3 on Microsoft Disk Operating System (MS-DOS) platforms, Multiplan initially lost appeal. In 1987, two years after its first release, Microsoft published version 2.0.
By 1988, this revised version, now available on Windows platforms, was outselling Lotus 1-2-3 and other comparable spreadsheet products.
Microsoft Excel 3 was introduced in 1990, featuring toolbars, 3D charts, and drawing and outlining capabilities.
Version 4 arrived two years later, adding the auto-fill capability. Finally, version 5 was launched in 1993. This version introduced macros for Visual Basic for Applications, allowing typical tasks to be automated.
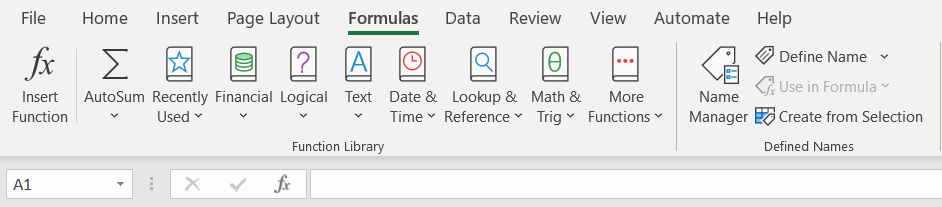
Version 12, published in 2007, was one of Excel's major modifications. A new Ribbon menu structure was implemented in this upgrade. Improved functionality included:
- A SmartArt set of diagrams.
- Easier administration of named variables.
- Increased formatting flexibility for graphs.
NOTE
Excel has also transitioned to more organized and open XLSX files. Version 15 was published in 2013 and featured new features, including Power View and Power Pivot.
Excel 16, the most recent version, was published in 2019. It has been one of the most extensively used business programs since its inception, and it is frequently used in conjunction with other Microsoft products such as Word, Outlook, and PowerPoint.
Although Microsoft no longer updates Excel in various versions, it automatically brings out new features and changes over time.
Microsoft Excel is widely used in organizations and is likely one of the most popular spreadsheet software. Today it faces growing competition due to the popularity of other modern spreadsheet tools. The following are some examples:
1. Google Sheets
It is a free Excel rival with comparable layouts and capabilities. Google Sheets is accessible to those who have a Gmail account. Because Google Sheets is stored in the cloud, users can access their spreadsheets from any location and device. Multiple people can also work on the same spreadsheet at the same time.
2. Numbers
Apple's spreadsheet software is included with every Mac and includes pre-built layouts, charts, and graphs. Numbers excels in visuals and charts, but it is less capable of handling big data sets than Microsoft Excel.
NOTE
Numbers is also only available on Apple devices.
However, it allows users to save spreadsheets as Excel files, allowing a Windows user to access a Numbers spreadsheet in Excel.
3. Apache OpenOffice Calc
This free, open-source spreadsheet software includes multiple-user collaboration, natural language formulas, allowing users to create formulas using words, DataPilot, which pulls data from corporate databases, and style and formatting features, which allow users to format cells in a variety of ways.
The software offers fewer chart possibilities than Excel and utilizes a distinct macro scripting language. OpenOffice Calc is available for both Windows and macOS. It defaults to the Open Document Format, which is relatively limited and compatible with Microsoft's XLSX format.
Conclusion
While Excel may not be the most cutting-edge or current tool in some industries, it is extensively utilized and highly valued in many financial and commercial settings. This is because it is a powerful tool for organizing, analyzing, and manipulating data, and it has several features that make it well-suited to these tasks.
Accountants and analysts, for example, often use Excel to create and manage budgets, track spending, and conduct financial research. Likewise, investment bankers may use it to generate financial forecasts, examine investment opportunities, and prepare client presentations.
Excel's ability to do computations, generate charts and graphs, and manage large amounts of data makes it a must-have tool for these professionals in all circumstances.
However, it is critical to remember that Excel is one of the numerous tools available to financial professionals.
In recent years, several new tools and platforms have been developed for financial analysis and modeling. Some may be better suited to specific tasks or more efficient in specific cases.
Conversely, Excel is a widely utilized and popular program projected to remain so for the foreseeable future.
WSO offers outstanding courses that might assist you in achieving your goals. For example, our EXCEL MODELING COURSE is designed to help you master Excel and Thrive in the Most Prestigious Jobs on Wall Street.

Free Resources
To continue learning and advancing your career, check out these additional helpful WSO resources:


or Want to Sign up with your social account?