GEOMEAN Function
Returns the geometric mean for a set of numeric values


What Is The GEOMEAN Function?
The GEOMEAN Function is a tool used to find the geometric mean return, which is a type of average or mean. The geometric mean return is determined by taking the nth root of the product of n rates, i.e., r1, r2, r3…rn
By calculating the geometric mean return (also called geometric average return), you can gauge the performance of the investments whose returns grow by compounding (rather than through linear growth) over a certain period. In simple terms, geometric mean return accounts for the compounding effect over time.
Geometric Mean Return Formula
The geometric mean return is calculated using the formula:

where,
r = rate of return on investment
n = time period/ number of periods
We will now move on to a couple of examples of how to calculate the geometric mean return for an investment using the above formula.
Example #1
Assume that you invest $1,000 in the bond market such that the returns generated are 6.25% for the first year, 4% for the second year, 5.5% for the third year and 6.15% for the fourth year. The arithmetic mean return for the investment is given by:
= (6.25 + 4 + 5.5 + 6.15) / 4
= 23.9
= 5.475%
By substituting these values in the geometric mean return formula, the equation becomes:
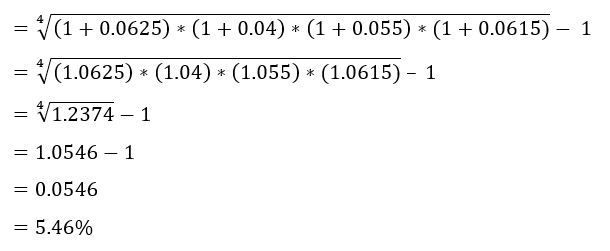
We get a result of 5.46%, which is the geometric average return the bonds will generate by considering the compounding effect of returns over 4 years. On the other hand, the arithmetic average return, as we have seen above, is 5.475%. Even though the difference between them is not that significant, you can see the changes in the amount of interest and the ending balance in the spreadsheet.
For example, the ending balance is $1,229.43 for the geometric mean return method, while it is $1,237.47 for the arithmetic mean return method signifying a discrepancy of $8.04.
Now assume if you would similarly calculate the returns for a highly volatile investment product over a varied period. As the amount of investment and the compounding period increases, so does the difference of ending balance between the two methods.

Hence, the total amount you will be earning after four years will be $1,259.13 on an investment of $1,000 in the instrument that generates a compounded return of 5.97%.
Example #2
Let's say that you invest $1,000 in a volatile cryptocurrency. You generate a return of 15% for the first year, 32% for the second year, 215% for the third year, and -30% for the fourth year.
The arithmetic mean return for the investment is given as:
= (15 + 32 + 215 - 30) / 4
= 232 / 4
= 58%
By using the inputs in the geometric mean return formula, the returns can be calculated as:
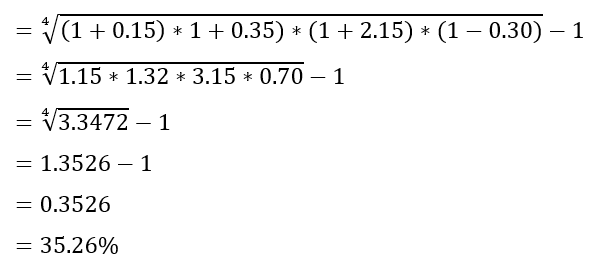
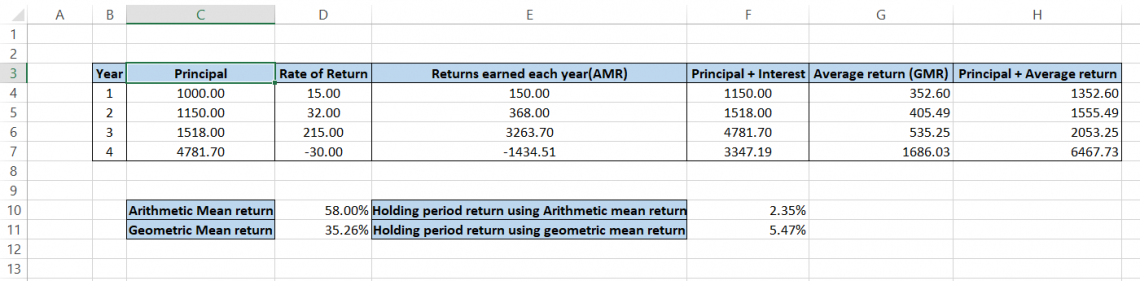
The arithmetic and geometric mean returns are significantly different as the values are 58% and 35.26%, respectively. The holding period returns also show a huge difference where 2.35% is earned based arithmetic average return while using GMR yields a 5.47% return.
Geometric mean in Excel
The Excel function GEOMEAN allows you to calculate the geometric mean for a set of numerical values. In practical terms, you can use the function to calculate the average rate of return based on variable rates. It is valuable in financial modeling, where most returns are calculated based on a compounding rate and not a simple interest rate.
Syntax for GEOMEAN function
The syntax for the GEOMEAN function is:
=GEOMEAN (number1, [number 2])
where,
number1: cell or range of cells containing the first value
number2: cell or range of cells containing the second value (optional)
NOTE
You will get a #NUM! Error if you reference negative values for number1 or number2 parameters.
Example of GEOMEAN function
Assume that we need to calculate the geometric mean of the four numbers 9, 8, 5, and 4.
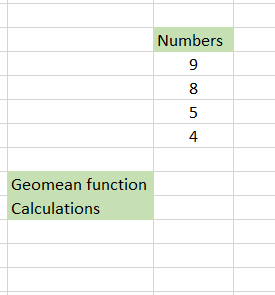
The traditional method would be to multiply those numbers and then take the fourth root of the number, giving you the final result. Instead, we have used the formula =POWER((D4 * D5 * D6 * D7), (1/4)) which gives the result 6.160141. Quite complicated, right?!
Here comes the GEOMEAN function. All you need to do is use the formula =GEOMEAN(D4:D7), where D4:D7 is the range of cells for which we need to find the geometric mean. You will get the result as shown:
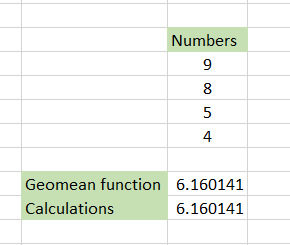
What was once so complicated became simple with the help of GEOMEAN function!
NOTE
If you calculate the arithmetic mean for the numbers, you will get 6.5.

Calculating Geometric Mean Return using GEOMEAN function
We will now show you how to calculate the geometric mean return using the GEOMEAN function in Excel.
Assume that your crypto portfolio earns 15% for the first year, 32% for the second year, 215% for the third year, and -30% for the fourth year.
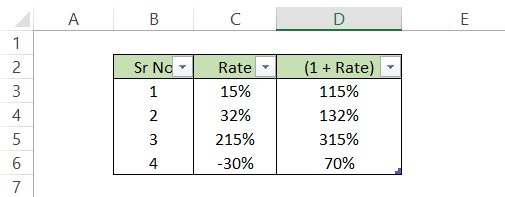
We have made an additional column that calculates the gross return (1+rate) since the formula for geometric mean return for this portfolio is:

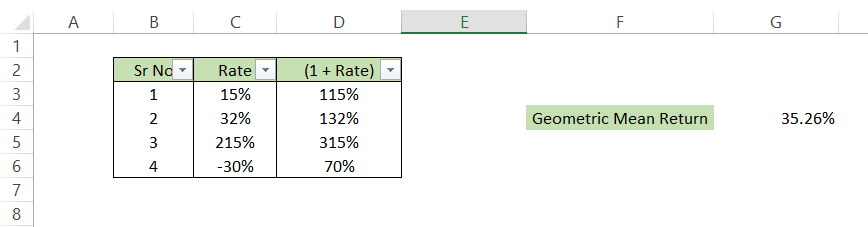
If you directly use the GEOMEAN formula on values in the C column, you will get wrong results. We use the formula =(GEOMEAN(D3:D6)) - 1 which results in a 35.26% mean geometric return. Note that we subtract one from our result to get a compounded annual return.
Additionally, you can find the GEOMEAN using the values in the C column to check whether you get the same result. You will notice that you get #NUM! An error that indicates the presence of a negative value in the range of cells thus strengthening the importance of the additional column 1 + rate. The final result that you will get is as illustrated below:
Why Geometric Mean Returns?
As you can see from the example above, the geometric mean return of 35.26% that we have calculated is relatively lower than the arithmetic mean return.
The latter tends to exaggerate the returns if there exist any outlier values such as 215% returns earned in year 3 and thus misleads investors/analysts. Another reason arithmetic mean does not gauge the performance of the investment properly is because it is easily affected by huge fluctuations in the YoY returns, i.e., in year 2, the returns were 32%. In contrast, in year 3, the returns were 215%.
Hence, even though finding the arithmetic mean return is an appropriate method in some cases, it's best to determine the average return using the geometric mean method that is not affected by outliers and considers the concept of compounding.
If the cash flows from an investment are volatile, then arithmetic and geometric mean returns will diverge from each other and vice versa. However, it is improbable that returns will be stable, especially over long time horizons.
Hence, in cases where the arithmetic and geometric mean returns show divergence, the former is always higher than the latter.
Applications of geometric mean return in Finance
Returns for investment instruments that compound over a period are best calculated as geometric mean returns. The reason is that GMR also accounts for the holding period of the investment. As a result, geometric returns are an essential parameter to determine how successful you have been in choosing the asset class as a choice of investment.
By comparing two investment returns in the present or future, you can make better financial decisions in the long term. We will see examples based on the future and present value and determine which investment option is best suited for us.
Example - Future Value
Assume that you invest $5,000 in bonds for 10 years with a yield to maturity (YTM) of 5.83%. The formula that we will be using to calculate the future value of the bonds is:
FV = PV * (1 + r)n
where,
FV = future value of the investment
PV = present value of the investment
r = interest rate
n = time period
In this scenario, the YTM represents the geometric mean return of these bonds. Substituting the parameters from the formula above, we can calculate the future value as:
FV = 5,000 * (1+0.0583)10
FV = 5,000 * (1.0583)10
FV = 5,000 * (1.7623)
FV = $8,811.5
Thus, the bond's future value (the amount the investor can expect to receive) will be $ 8,811.5 at the end of 10 years.
Making your own Geometric Mean Return Template
It can be quite a hassle to calculate the roots to the nth power over a period. So we have come up with a simple template that you can build by yourself in just 5 mins!
Steps for building the template:
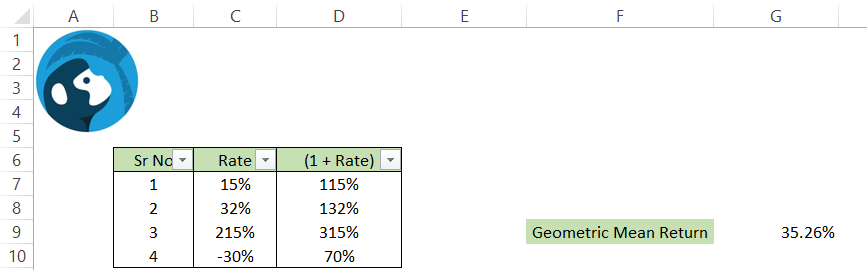
- Create a table in Excel with details as illustrated above (components of the formula are broken down into separate columns while the entire value under the root is in cell G7) by selecting the data to create a table. This way, any new entries will be automatically accommodated in our formula.
- For cell D7, use the formula as =(1 + C7) and drag it up to the last cell.
- Select the range from C7 up to the last cell and the format to ‘Percentage’. You can use the Excel shortcut key of Alt + H + N + P and then press Enter.
- Finally, in cell G9, use the formula =(GEOMEAN(D7:D1048576))-1 to return the geometric mean return for n product of rates and period of time.
GMR Template
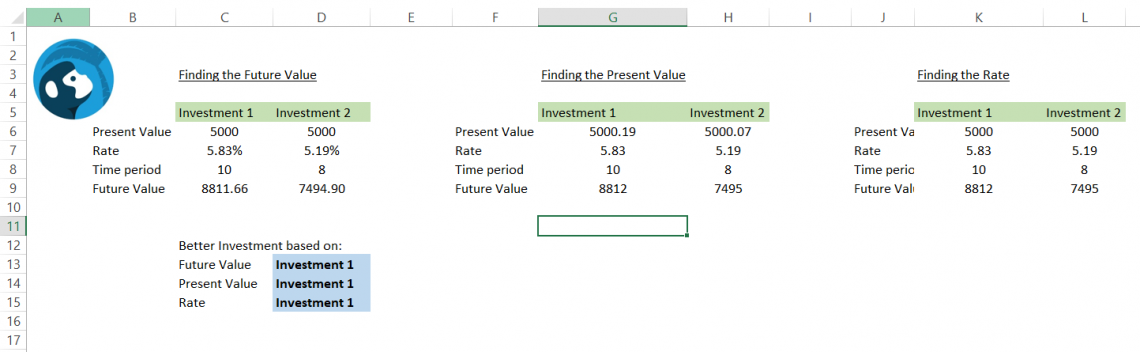
This template will let you calculate Future Value, Present Value, or Rate by inputting the values once the formulas are hardcoded in the spreadsheet. For each section (‘Finding the future value), we will hardcode a formula for the respective result while the rest of the values will be input as per the requirement.
Steps on preparing the template:
‘Finding the Future Value’ section
- Use the formula =C6 * (1 + C7)^C8 in cells C9 and D9, which will calculate the future value based on present value, rate, and time period inputs.
- Cell D13 will have the formula =IF(C9>D9, C5, D5) that will compare the investment based on the future value.
‘Finding the Present Value’ section
- By using the formula =ROUND(G9 / (1+(G7/100))^G8, 2), you can easily calculate the present value from the input data.
- Based on the result obtained from the formula =IF(G6>H6, G5, H5) in cell D14, we can determine the choice of investment based on present value.
‘Finding the Rate’ section
- Use the formula =ROUND(POWER((K9/K6), (1/K8)) - 1, 4) * 100 to calculate the rate based on input values.
- To find better investment based on rate, use the formula =IF(K7>L7, K5, L5) in cell D15.
NOTE
Calculation of time period n requires future value/ present value table, and hence we have not demonstrated the Excel method to calculate time period.

More on Excel
To continue your journey towards becoming an Excel wizard, check out these additional helpful WSO resources.


or Want to Sign up with your social account?