Financial Model Formatting: Colors
The presentation of data in a way that makes it easier for the user or reader to easily recognize and correlate certain pairs of data.


What is Financial model clarity with color formatting?
Financial models play a crucial role in shaping decisions within the finance sector, providing essential perspectives that shape critical business selections. Nonetheless, these models frequently resemble intricate puzzles, presenting users with the task of swiftly navigating them.
Then enters the powerful technique of Color Formatting in Financial Models, transcending complexity and enhancing comprehension.
This approach possesses the ability to transform intricate spreadsheets into visually appealing and exceptionally enlightening documents, thereby facilitating improved understanding.
Financial model clarity with color formatting refers to the practice of using colors to make a financial model or spreadsheet easier to read and interpret.
Financial Model Color Formatting is an effective solution that can convert these intricate spreadsheets into visually appealing and informative documents.
In this extensive guide, we will explore the art and science of Financial Model Color Formatting.
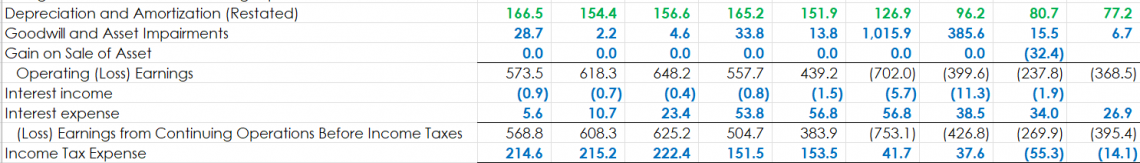
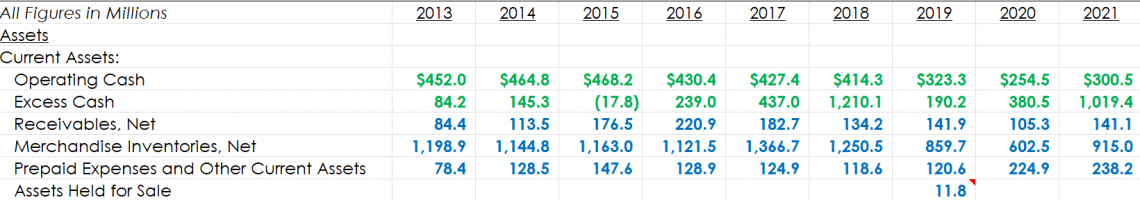
- Color formatting in Excel helps users easily identify the original and calculated data values and links to other cells on different sheets or tabs. This aids in error correction and data validation.
- Colors help users correct errors, link multiple sheets, and see calculations better.
- Color Code:
- Blue denotes pre-defined values
- Black denotes a calculation
- Green indicates values referring to other cells
- Red highlights link to external data websites/sources
- Conditional formatting with color shading can effectively illustrate trends in the data values.
Enhancing Financial Model Clarity with Color Formatting
The process of color formatting in financial models is a technique used by analysts to enhance the clarity and presentation of financial spreadsheets.
Colors make the model more user-friendly and easier to interpret, allowing users to identify the nature of numerical data, whether it's historical, current, or future forecasts.
Using colors to highlight specific data types makes the document visually appealing and segregates different categories of data that require the reader's attention. Color formatting is applied to cells and data within each financial model.
The most commonly used color formatting includes:
- Blue: Used for hard-coded (typed) inputs, such as historical data or key drivers like interest rates or tax rates.
- Black: Designates calculations and cell references within the same sheet. Formulas are presented in black text.
- Green: Indicates calculations that reference data in other sheets. However, some users may prefer to use black formatting here.
- Red: Highlights external links to data stored outside the model or indicates negative numbers. The use of red text is optional, and these elements can also be presented in black.
Here's an example that illustrates how various colors are used in financial models and how readers can interpret the data based on color:
Shading Color Formatting
Shading color formatting is another technique using colors to distinguish different spreadsheet parts, primarily separating headings and subheadings from detailed calculations. Shading serves to break down content into easily digestible sections.
Here's how to effectively use shading:
- Headings: Make headings stand out by employing techniques such as bold font, distinct font types, underlining, or using a unique background color. Headings can include the company name or the title of a specific worksheet.
- Subheadings: Light gray with black font or light blue with black font is ideal for subheadings. These often pertain to column reference cells, such as particulars or years.
- Featured Line Items: Important areas or line items in the file can be highlighted with any color using a bold font to draw attention.
The Power of Color Formatting
Color is a universal language that transcends barriers and enhances communication. When strategically incorporated into financial models, it serves as a visual guide, leading users through the data effortlessly.
The potential of color formatting is vast and includes:
- Highlighting Critical Values: By using vibrant colors for essential figures such as revenue, expenses, and profit margins, you can draw immediate attention to key elements, ensuring that users focus on what matters most.
- Error Identification: Color-coding error cells or discrepancies make it a breeze for users to identify and rectify issues within the model, reducing the likelihood of financial missteps.
- Scenario Analysis: Color can distinguish between different scenarios, making it easier for users to compare various assumptions and their impact on financial outcomes, ultimately leading to more informed decision-making.
- Trend Analysis: Gradual shifts in data can be made more apparent through color gradients, facilitating trend analysis over time.
Best Practices for Color Formatting
To unleash the complete power of color formatting in financial models, adhering to a series of fundamental principles is crucial. These guidelines play a vital role in guaranteeing that your utilization of color effectively serves its intended purpose.
Upholding a harmonious color palette is essential to enhance the appeal and comprehension of your financial model. Allocate distinct colors to different data categories, such as revenue, expenses, or calculations.
Although color can improve clarity, excessive utilization can result in a disorganized and bewildering experience. Using color in moderation and with intent is advisable, specifically highlighting elements that truly necessitate emphasis.
An uncluttered design model ultimately enhances user-friendliness. Maintaining consistency in color usage establishes a lucid and instinctive pattern, facilitating users in effortlessly interpreting the information provided.
To unlock the full potential of color formatting in financial models, adherence to best practices is crucial:
- Consistency is Key: The secret to success lies in being consistent. Ensure a uniform color scheme is maintained throughout your model. Allocate distinct colors to different data categories (e.g., green for revenue and red for expenses) to establish a clear and easily understandable pattern.
- Avoid Overuse: Although color holds significant value, its excessive utilization can result in disorder and perplexity. It is advisable to employ it judiciously, directing attention towards elements that necessitate emphasis.
- Consider Accessibility: Ensure that all users, even those with color vision difficulties, can see and understand the colors you choose. Use palettes specifically designed for people with color blindness to ensure inclusivity.
- Ask for Clarity: Before finalizing your color scheme, consider asking team members if a specific firm-aligned color scheme is used to stay uniform in the presentation.
Implementing Color Formatting in Excel
Enhancing the visual appeal and improving the comprehensibility of financial models in Excel involves implementing color formatting, which is a crucial and fundamental step. Excel is highly acclaimed and widely utilized in finance, offering many options.
Microsoft Excel, a ubiquitous tool in finance, offers various options for effective color formatting:
- Conditional Formatting: The conditional formatting feature in Excel streamlines the process of applying colors based on predetermined rules. For instance, you have the ability to emphasize cells with values surpassing a designated threshold by utilizing the green color while indicating values below the threshold by using the red color.
- Color Scales: Color scales allow the creation of heatmaps, facilitating the visualization of data changes. They are useful for trend analysis and comparing different data sets.
- Data Bars and Icon Sets: Excel allows applying data bars and icon sets to cells, enabling the visual representation of data. For example, data bars can effectively communicate the relative size of values within a given range.
Real-World Examples
Let's explore real-world scenarios to illustrate the effective application of color formatting:
1. Dashboard Visualization
Begin with a financial dashboard showcasing key metrics like revenue, expenses, and profit. Employ color to indicate whether each metric is on target (green), requires attention (yellow), or falls below expectations (red).
During scenario analysis, employ color coding to distinguish between different scenarios swiftly. This simplifies decision-making by highlighting the best and worst-case outcomes.
Industry Standards for Financial Model Color Coding
To ensure that monetary designs are universally comprehended, it's crucial to stick to industry standards for shade coding. Uniformity in shade usage is vital, as it establishes a shared language that goes beyond individual interpretations.
These shade principles establish a collective structure for fiscal blueprint understanding. Skilled shareholders and experts have arrived at anticipated distinct connotations linked with varied hues, permitting swift comprehension.
Industry standards for color coding enhance the professionalism of your financial model. To ensure that financial models are universally understood, it's vital to adhere to industry standards for color coding:
Color of Text
Effective formatting is essential, enhancing the accessibility of financial models through techniques like color coding, clear fonts, and structured layouts.
Thorough documentation ensures transparency and ease of collaboration, while customized charts and visualizations make complex data more comprehensible.
Mastery of Advanced Excel formatting empowers you to perform intricate calculations, and continuous learning, such as Wall Street Oasis courses, keeps your modeling skills sharp.
Below is a breakdown of a typical color scheme that is used in models:
- Blue: Designates inputs, encompassing historical accounting data, growth assumptions, or any data entered for projections.
- Black: Represents calculations. Black text is used when calculations refer solely to data within the current sheet. Calculations referencing data in another sheet can be black or green.
- Green: Indicates calculations involving references to another sheet.
- Red: May designate references to external data stored outside the model or indicate negative numbers. However, coloring text for these elements is optional, as they can also be presented in black.
Color of Shading
Shading, or background color, differentiates information within the model to enhance readability. Some of the benefits of shading color include:
- Shading Separates: Shading differentiates headings, labels, and sums from raw data.
- Highlights Noteworthy Data: Shading can also draw attention to specific data for various positive or negative reasons.
- Use Shading Conservatively: To avoid overwhelming readers, use shading judiciously. Excessive use of colors within a single sheet can confuse the reader.
Conditional Formatting
Conditional formatting is a characteristic accessible in most spreadsheet programs that dynamically alters the look of cells based on their content. It's a flexible instrument that can accomplish more than just emphasize pessimistic numbers.
It can automatically arrange cells containing certain keywords, detect anomalies, or highlight important data points. However, exercising care when using conditional formatting is crucial, particularly in the ultimate edition shared with investors or stakeholders.
Although it can improve the visual attractiveness of your design, an overabundance or random application of hues and designs can result in perplexity.
A well-planned and deliberate approach to using colors can efficiently direct your audience's focus to the main observations without burdening them with visual disturbance.
Personalizing Your Model
In financial modeling, accuracy and transparency are crucial. Nevertheless, within the limits of industry norms, there is a distinct chance to incorporate a hint of customization into your financial model that harmonizes effortlessly with your brand image.
This strategic customization not only imparts a unique character to your model but also strengthens your brand's presence and expertise in the eyes of stakeholders, investors, and clients.
Below are the more prominent ways of making your model more relevant for reviewers:
1. Correct and Proper Color Formatting
Correct color formatting improves user-friendliness and clearness, creating an enticing and user-friendly model. One of the quickest and most identifiable methods to customize your financial model is by integrating your company's trademarked color palette.
By infusing your brand's hues into the spreadsheet, you can enhance the visual appeal of the data.
Apply these hues for headings, cell backgrounds, and chart elements. This understated yet influential alteration guarantees that your economic blueprint becomes immediately recognizable as an essential component of your brand.
2. Typeface Selection
Typeface selection plays a frequently overlooked role in personalization. By following a particular typeface or typography in line with your brand guidelines, you uphold coherence and establish a visual character that surpasses your financial model.
3. Balance is Key
Maintaining a harmonious color palette is crucial. It is important to refrain from excessive color usage, making sure that the colors chosen enhance the design's overall visual appeal and readability.
4. Brand Protection
Safeguard your brand's copyright/patent by including a standard footer or copyright. This not only strongly defends/strongly expresses your brand's ownership but also safeguards your model's quality.
The skillful craft of customizing your financial model resides in seamlessly integrating branding aspects and user-friendliness. Ultimately, the objective is to generate a model that is not only polished and sophisticated but also effortlessly communicates financial data.
Importance of Color Formatting
The importance of using color for formatting data in financial models cannot be overstated:
- Ease of Identification: Color formatting aids the easy identification of cells and distinguishes between direct input and calculations, allowing users to identify areas where changes can be made.
- User Engagement: It engages users in the model's workings, making it more attractive and appealing.
- Consistent Flow: Maintaining a consistent flow enhances the model's understandability.
- Visual Hierarchy: Creating a visual hierarchy within the sheet facilitates navigation. Clear distinctions in the coloring of headers, titles, and subheadings make data identification easier.
- Understanding Data Impact: Colors help users grasp the effect of different data types on the final output.
- Use in Print: Colors are useful in printed copies, ensuring readability in hard-copy presentations.
Conclusion
Financial Model Color Formatting is a potent technique for enhancing the clarity and impact of financial models. Color formatting simplifies complex data, highlights critical insights, and improves decision-making when applied thoughtfully and consistently.
By adhering to industry standards and best practices, financial professionals can unlock the potential of color formatting to communicate financial information effectively.
Incorporating color formatting into your financial models can transform them from plain spreadsheets into dynamic tools that drive better insights and decisions.
Whether you're a financial analyst, manager, or executive, mastering the art of color formatting is a valuable skill that can set you apart in finance.
Remember, the key to successful Financial Model Color Formatting lies in balance and thoughtful implementation.
When used in moderation and with a clear strategy, color formatting can unlock new levels of understanding in your financial models, making them truly impactful and user-friendly. So, don't hesitate to add a touch of color to your financial world!


or Want to Sign up with your social account?