Financial Model Formatting
Guide to financial model formatting


Financial modeling is the process of creating an Excel spreadsheet of a company’s historical and future performance. The process involves a combination of different metrics with the purpose of forecasting the company’s future results.

Building a financial model requires expertise, time, and effort. The forecast is usually based on historical information and assumptions about the company’s future performance, including company-specific and various economic assumptions.
Financial professionals prepare multiple types of financial models inside and outside the company. The most common are:
- The three-statement model: a model that involves the preparation of an income statement, balance sheet, and statement of cash flows.
- Discounted Cash Flow (DCF) model: a model based on the net present value of the company’s future cash flows. The model uses the three-statement model as a base.
- Merger (M&A) model: a model used to evaluate the effects of merger or acquisition and usually includes individual results of the companies and the consolidated results of the merged company.
- Leveraged Buyout (LBO) model: a model that focuses on the company’s capital structure and requires advanced modeling of debt schedules.
Typically, you will start with preparing a three-statement model along with the supporting schedules and proceed to more advanced models such as DCF, M&A, and LBO.
Financial models play an important role when it comes to decision-making; they are used to make decisions when it comes to raising capital, considering an acquisition/divestment of an asset or a business, valuing a company, and many more.
Now that you understand the importance of financial models, let’s concentrate on the importance of financial model formatting. Proper financial model formatting is important because it makes understanding and analyzing the model easier.
- Financial modeling is the process of using different metrics to forecast the company’s future results.
- Multiple financial models are available, depending on the purpose: the three-statement model, discounted cash flow, merger model, and leveraged buyout model are among the most popular ones.
- The key to building a good model is understanding its purpose and timeline.
- There are no set rules when it comes to formatting the model; each company may have its own guidance.
- Model formatting helps to keep the model clean and easy for the users to read/analyze.
- Color and number formatting, shading, and referencing should be kept in mind when formatting the model.
The Financial Model Structure
Before we proceed with formatting tips, let’s look at how one would plan and structure the model.

The key to every model is understanding the purpose and the timeline:
-
Purpose: Understanding the purpose will help you understand the model's layout and structure.
-
Timeline: knowing how much time you have for building the model and how long it will be used for will help adjust the structure respectfully.
Every model should generally be divided into three sections – inputs, calculations, and outputs. Additionally, it is common to include the following tabs when preparing the model in Excel:
1. Cover Page
It summarizes general information relating to the model (name, purpose, summary of other tabs), provides the author’s contact information, and may include disclaimers, if any.
2. Drivers
It summarizes the model’s inputs and assumptions, which could be either static (do not change over time) or dynamic (change over time).
3. Model
It’s one of the main tabs and typically includes the actual model and the respective calculations.
4. Outputs
It summarizes the most important model highlights and could come in the form of summarized information, graphs, tables, etc.
5. Scenarios and Sensitivities
It provides a range of scenarios and sensitivities as a result of changes in one variable while keeping the other variable constant and changes in multiple variables at the same time.
The Financial Model Formatting
There are no set rules when it comes to formatting the financial model. Each company may have its guidance. Thus, it is important to factor this in when building a model. Detailed below is the universal approach of many companies on Wall Street.

When applying Financial Model Formatting, keep in mind the main attributes of a good financial model: consistency, clarity, and efficiency. When formatting is used properly, it enhances all three of these.
1. Color formatting of cells’ content
Adherence to certain color formatting rules helps keep the model clean and easy for the users to read/analyze. The most commonly used colors for both text and other content of cells are:
-
Blue – applied to hard-coded inputs, which could be historical information or some of the other inputs.
-
Black – applied to calculations and references within the same worksheet.
-
Green – applied to references in the same Excel file but outside of the model worksheet.
-
Red – applied to external references/links (other Excel files).
At the same time, some of the models do not contain green or red color references, as black color is used instead. Additionally, sometimes red is used to highlight an error, while purple is introduced to highlight the external references/links.
Finally, some analysts use dark red when referencing information from databases like Bloomberg, Capital IQ, and such.
One thing to point out here is that no automatic function in Excel can help you with the color coding specified above. This has to be done by hand or with the help of macros.
2. Shading
Shading is the process of applying a similar texture (color formatting) to particular cells. In financial modeling, shading highlights headings, subheadings, featured line items (important information you want to highlight), etc.
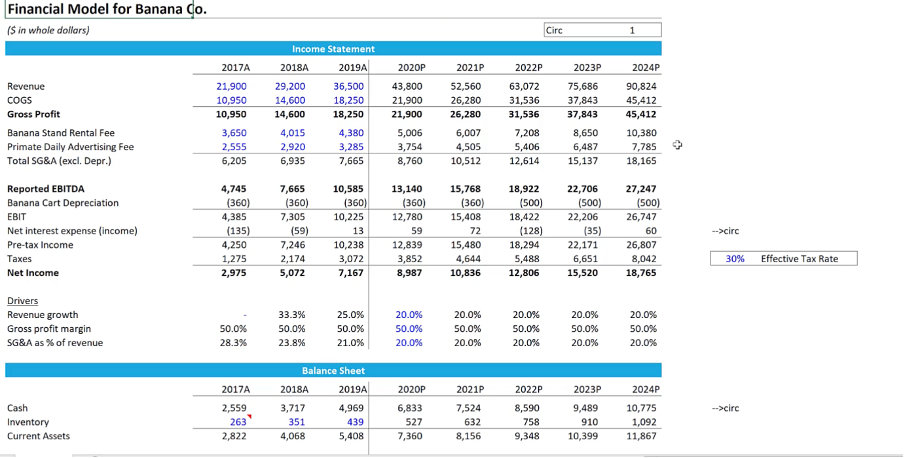
For example, the Income statement and the Balance sheet lines were highlighted using shading in the picture above.
Shading can be used as you see fit as long as it enhances the model's consistency, clarity, and efficiency.
3. Conditional color formatting
One of the features offered by Excel is called conditional formatting. It comes in very handy when one wants to highlight specific values/cells that contain values that meet a predetermined condition.

For example, you can set up a rule highlighting values above 22% in a row “SG&A as % of revenue” from an extract of the financial model above. Alternatively, you might want to point out a Net income above 11,000.
Whichever the case, make sure only necessary information is highlighted.
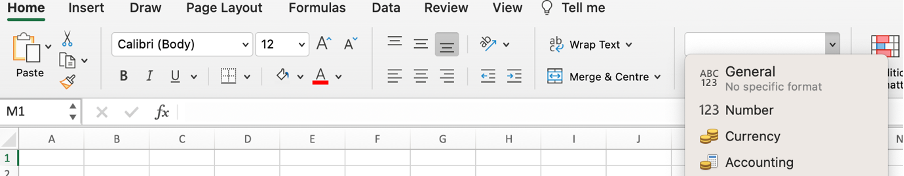
4. Number formatting
Regarding number formatting, the simple rule is trying to use one of the standard formats offered by Excel (number, currency, accounting, etc.). Doing so will reduce the risk of using different formats within the workbook.
5. References
When constructing a model, use either the embedded numbers or references. The absolutely worst idea is to embed inputs into the formula. Not only does this make it hard to audit the model, but it may also confuse the user.
Consider an example below where 2022 is the base year, and the years 2023 – 2026 are projections.
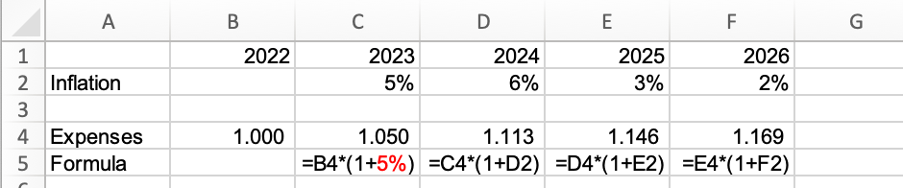
On top of that, you should only have one formula per row. In other words, the formula used in a first cell (C5 in the example above) should be applied throughout the entire row (C5 through F5).
The model users should be able to understand the model structure by looking at its first column.


or Want to Sign up with your social account?