Scenario Analysis vs Sensitivity Analysis
The differences between the two most common methods of investment and analysis


What Is Scenario Analysis Vs. Sensitivity Analysis?
With the increasing complexity of models and their variables, we need to be able to make inferences about what is going on based on limited data. For example, you might want to know the probability of an event happening given a certain parameter or variable or the effects of changing a parameter. This is where the scenario and sensitivity analysis come into play.
They are the two most prominent types of quantitative risk analysis. Scenario analysis is a method in which we input different values for the parameters based on various future states of the economy and examine the effects on output.
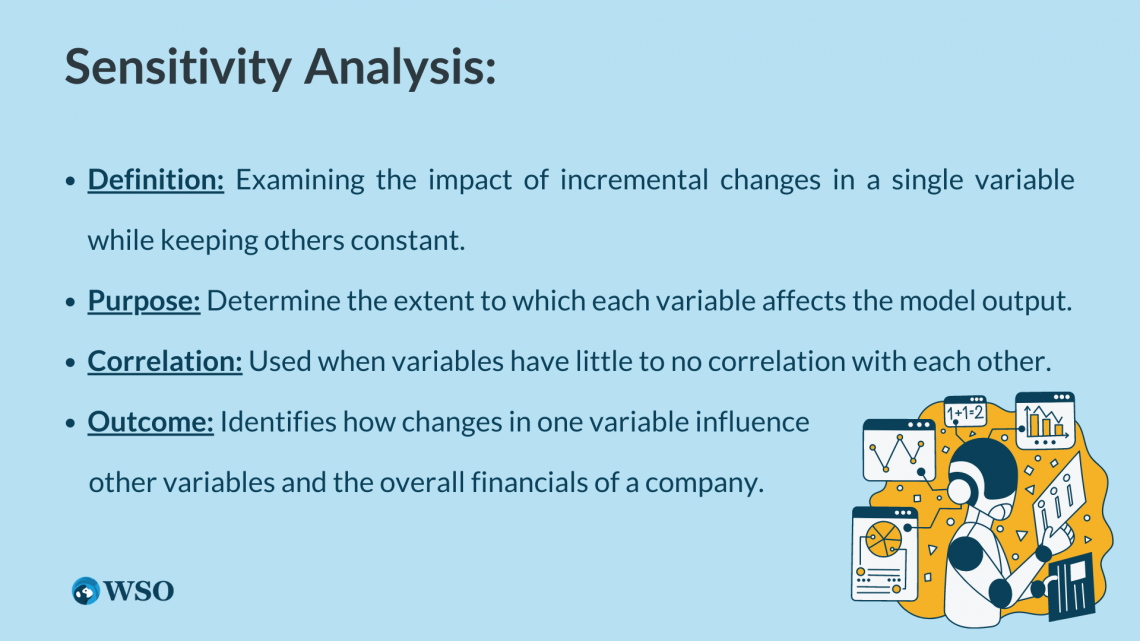
Sensitivity analysis is a method for determining how much each variable affects the output by changing it incrementally and examining the results.
Sensitivity analysis is often used in financial modeling to understand how each variable in the model acts, which helps to predict a range of values as opposed to pinpointing one.
To compare scenario analysis vs. sensitivity analysis, one should first understand that investment decisions are based on assumptions and inputs. The lack of certainty in the premises and inputs brings about investment risk.
Hence, it is best to assess the magnitude of such risks (through risk analysis) and weigh them against potential benefits before making an investment decision.
- Scenario Analysis involves evaluating the impact of different scenarios, each representing a specific set of assumptions about future conditions.
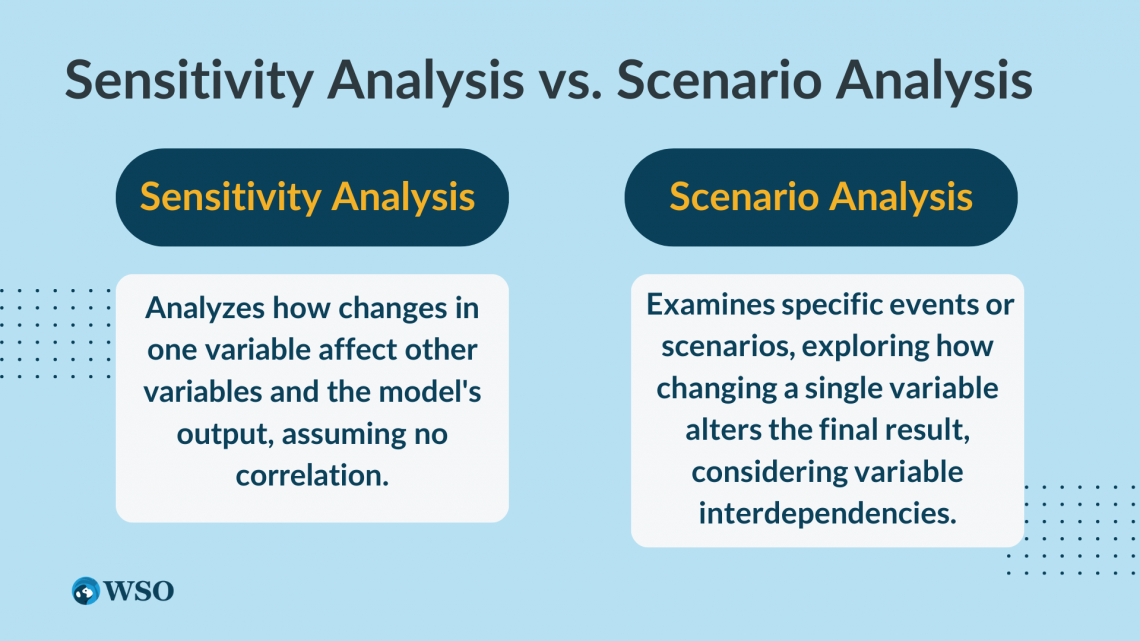
- Sensitivity Analysis examines how changes in a single input variable affect the outcome, keeping other variables constant.
- Scenario Analysis provides a broad view by considering multiple variables and their combined impact, making it suitable for strategic planning and comprehensive risk assessment.
- Sensitivity Analysis offers a focused approach by analyzing the effect of individual variables, helping to identify key drivers and improve model accuracy.
Scenario analysis: What is it?
Scenario analysis is a type of investment analysis wherein the investor considers different possible future scenarios and estimates their probabilities of occurring, usually from the best-case to worst-case scenario, with the base-case (usually expected to happen) somewhere in the middle.
It helps the investor to assess the likelihood of risks and benefits.
In other words, scenario analysis is an analytical tool that assists investors in determining the magnitude of risk associated with a particular investment and how much it would cost or benefit them based on what the future economic scenario looks like.
It is also known as "what-if" analysis because it asks what would happen if certain conditions changed.
Scenario analysis is much more important for smaller businesses since they are more likely to be impacted by an event as opposed to large companies that could have other divisions to offset such an event.
However, it is still useful in any organization simply because it is better to be prepared for different situations to minimize any negative effects they may have.
Sensitivity analysis: What is it?
Sensitivity analysis (or reasonability check) is a statistical technique that measures the effects of changes in one or more variables on a model’s output. It helps us understand which variables significantly affect the outcome of a model and which ones don’t.
One of the most common examples of sensitivity analysis is changing interest rates but keeping everything else constant.
Let’s say we had an equation with two unknowns: x and y. We assume what x would be, but we don’t know what y would be.
In order to find out how sensitive our equation is to the input for y, we change it incrementally and examine the results.
For a quick five-minute explanation on this topic, please watch this video:
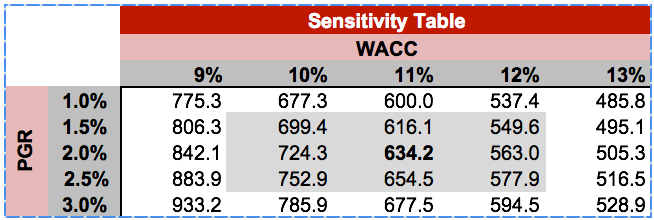
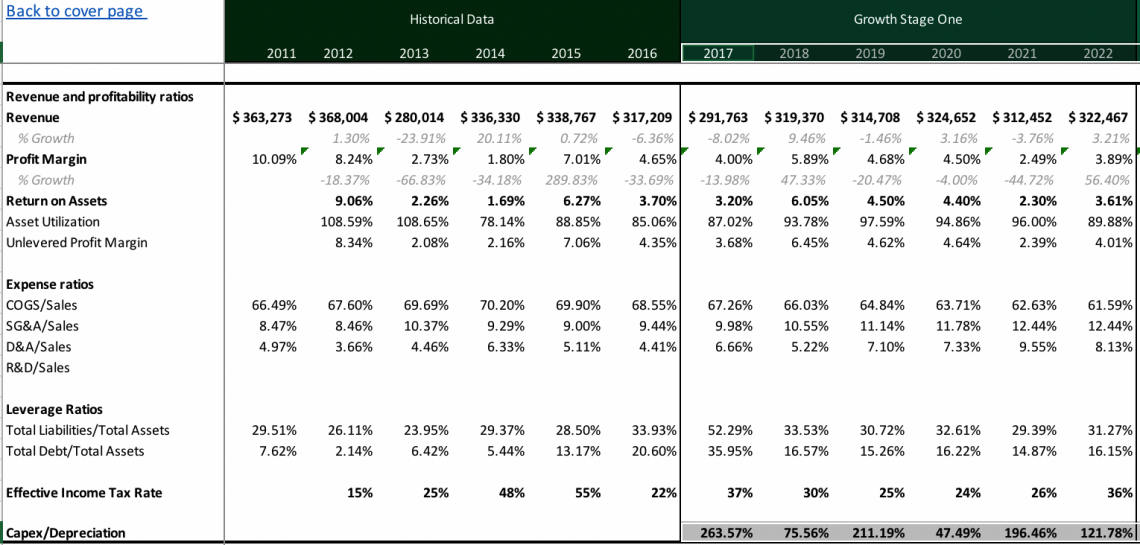
Sensitivity analysis can be better understood by exploring financial models that show how you can change a variable to see how it affects another variable in an investment portfolio under different scenarios.
Below is the sensitivity analysis table model template provided by WSO to test out an example of these types of changes.
What is the difference between sensitivity analysis and scenario analysis?
To assess the likelihood of a certain event happening, you’ll need to use scenario analysis. Scenario analysis is when you input expected values for the model’s parameters and examine the results by computing probabilities.
For example, if you wanted to know the effect of a future event on your investment, you would have to input the expected values for that parameter in such an event.
Sensitivity analysis is used to determine how much each variable affects the model output by changing it incrementally while holding other variables constant.
The key difference between these two types of analyses is subtle but important.
If you were using sensitivity analysis to calculate what happens to other variables and the financials of a company when one variable changes incrementally, then it’s possible that other variables may change due to one variable changing because they might be correlated.
Thus, sensitivity analysis is typically used when the outcome of a model relies on multiple input variables with little to no correlation between them.
While both forms of analysis can be thought of as “what if?” analysis, scenario analysis will go through a list of variables involved in an event, only looking at how changing a single variable alters the final result of the situation and what the possibility of this new result is.
An example of this is “what happens to the company’s value if the cost of materials increases?”
Examples of scenario and sensitivity analysis
As you can imagine, fluctuations in the stock market impact many aspects of the performance of a business. As a result, considering hypothetical situations regarding the market is an important task for companies that want to grow.
The events that occurred in 2020 and 2021 due to the global COVID-19 pandemic lend themselves as a great example, although this particular event would be quite difficult to predict.
In this particular scenario, it would be very difficult for some companies to survive (such as retail).
The effects of such scenarios in various industries always depend on the nature of the event, and in the case of the Covid pandemic, companies, or even industries, that relied on people going out suffered tremendously from heavy losses, such as:
- Movie theaters
- Aviation industry
- Tourism industry
Regardless, preparing for more such events in the form of a second or third wave will allow some of these companies to continue operations, such as pivoting to e-commerce stores or food deliveries for retail businesses.

However, the pandemic provided a once-in-a-lifetime opportunity for other stocks to grow exponentially.
For example, Peloton made considerable profits during 2020 due to an increased interest in exercising from home, and Zoom stock prices soared as online meetings became the norm.
Scenario analysis would also be helpful for these types of organizations as it could allow them to capitalize on opportunities rather than crumble under pressure (e.g., running out of materials to manufacture for Peloton or expanding server resources for Zoom).
In addition, they can also devise a strategy for the post-pandemic world by considering whether people will continue to use their products and services at the same volume or if consumer engagement will gradually decrease.
In fact, this is already beginning to be the reality for Zoom, as seen in the news, where the price of its shares started falling as the Covid pandemic began to an end.
Despite all that has been said, the goal of scenario analysis is not predicting what's going to happen in the future—it is simply identifying the best option based on the different possibilities and their implications and the probabilities of these scenarios happening.
It can be applied to many areas of finance, such as retail investing, where one of your options might be to sell off stocks before they crash for maximum financial gain or buy stocks at the bottom.
While this can be seen as fundamental or technical analysis, both these forms of analysis consider possible situations with the available information. Thus, scenario analysis has many applications in both finance and regular life.
As for sensitivity analysis, its most common use case is in financial modeling. This is because different financial models will focus on different variables. Looking at the three main types of models, we see that the different purposes of sensitivity analysis are:
- Mergers and acquisitions (M&A) models: Investigate how accretion/dilution are affected. Essentially, variables and assumptions are changed to see if the M&A deal becomes more or less profitable/costly.
- Discounted cash flow (DCF) valuation model: Look into how changes in terminal value (TV) or the discount rate affect other parts of the model, like the final net present value (NPV).
- Leveraged buyout (LBO) model: Analyse how the internal rate of return (IRR) is affected if the leverage and/or the purchase price change.
Advantages of Scenario Analysis
In scenario analysis, we input different values for the parameters and examine the results of each scenario based on their probabilities of occurring. It is a powerful tool for understanding how future events might affect the outcome. A few of the advantages of using scenario analysis are:
- More proactive risk management by assessing the impact of potential situations and possibly developing contingency plans
- Better decision-making as a result of investigating the benefits and risks of various options
- In addition to aiding the decision-making process for management in the present, it can also help companies navigate future decisions as planning allows them to adapt to situations quickly.
- A methodical approach to analyzing the future may help companies find opportunities or risks they may have otherwise overlooked.
Disadvantages of Scenario Analysis
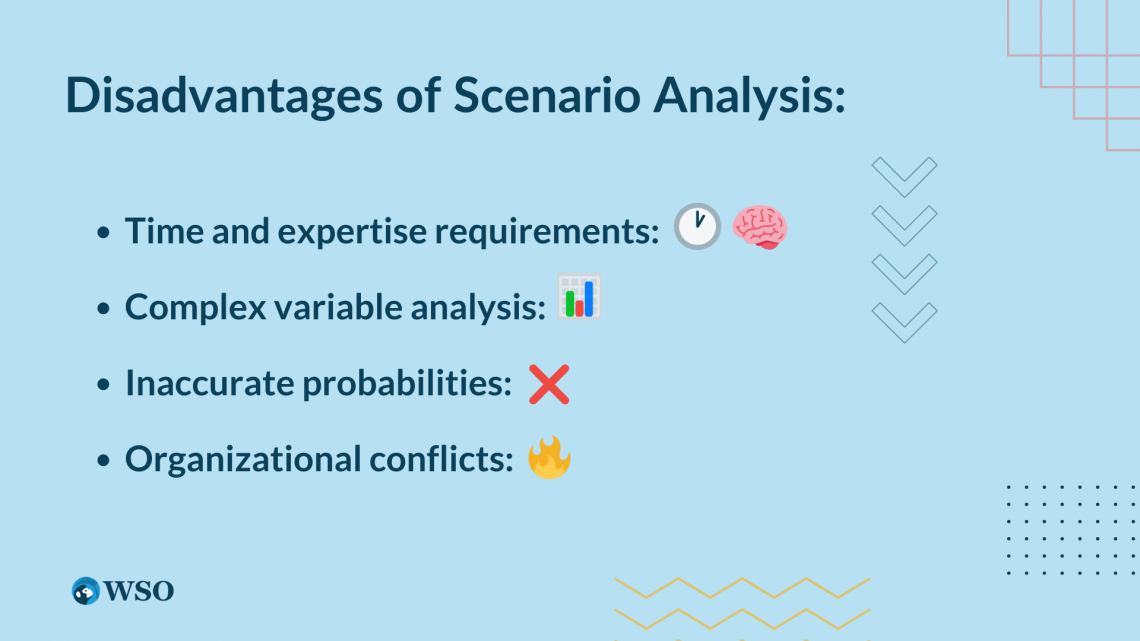
However, some issues arise from using scenario analysis. These include:
- A large amount of time (for practicing and performing the task), skills, and knowledge are required, though there are tools that can aid this.
- Challenging to consider all the possible scenarios since there are so many variables to analyze and make assumptions about
- The probabilities of the scenarios that get calculated are not always accurate.
- The outcomes may be opposed or cause conflicts within an organization, creating a new problem instead of a solution.
Advantages of Sensitivity Analysis
Sensitivity analysis is an excellent technique for determining how changes in one variable will affect another, rather than looking at the situation as a whole. As a result, the advantages of this type of analysis are:
- Sensitivity analysis is perfect for making decisions that involve exposure to specific variables.
- Since it requires an in-depth study into links between variables, it allows analysts to figure out the relationship between these variables, which in turn contributes to more accurate forecasting of the chances of success and failure for these variables (e.g., focusing specifically on ways to reduce costs)
- This in-depth analysis also means variables that are considered weak points (such as one that is extremely volatile) can be identified, and the effect of these can be mitigated. This is a major reason why sensitivity analysis is heavily incorporated into financial modeling.
For example, if you consider investing in Company A and Company B, there are many factors to consider, including the business's financial strength, management quality, and expected growth rate. Sensitivity analysis can help you determine which company has a better impact on your investment portfolio.
An investor would want to know the impact of Company A's financial strength on risk.

and management quality

The higher the number of these variables, the higher the risk index. You want to minimize risk as much as possible for your investment portfolio.
Disadvantages of Sensitivity Analysis
Sensitivity analysis is generally performed based on assumptions made by management and, therefore, is highly dependent on the accuracy and validity of these assumptions (i.e., garbage in = garbage out). If these assumptions are wrong, then the analysis will also be incorrect.
In addition to this, since this form of analysis focuses on one variable at a time, it does not provide investors with a complete picture.
For instance, if some variable C is affected by two other variables, A and B, performing sensitivity analysis would determine A's effect on C and B on C, but not A on B and vice versa.
Hence, in the real world, where multiple variables are affecting each other, there can be some vital information that gets left out if an analyst does not consider all the possibilities.
How to Perform Scenario analysis?
Scenario analysis in financial modeling helps management understand how an event will play out and the possible outcomes and implications of it.
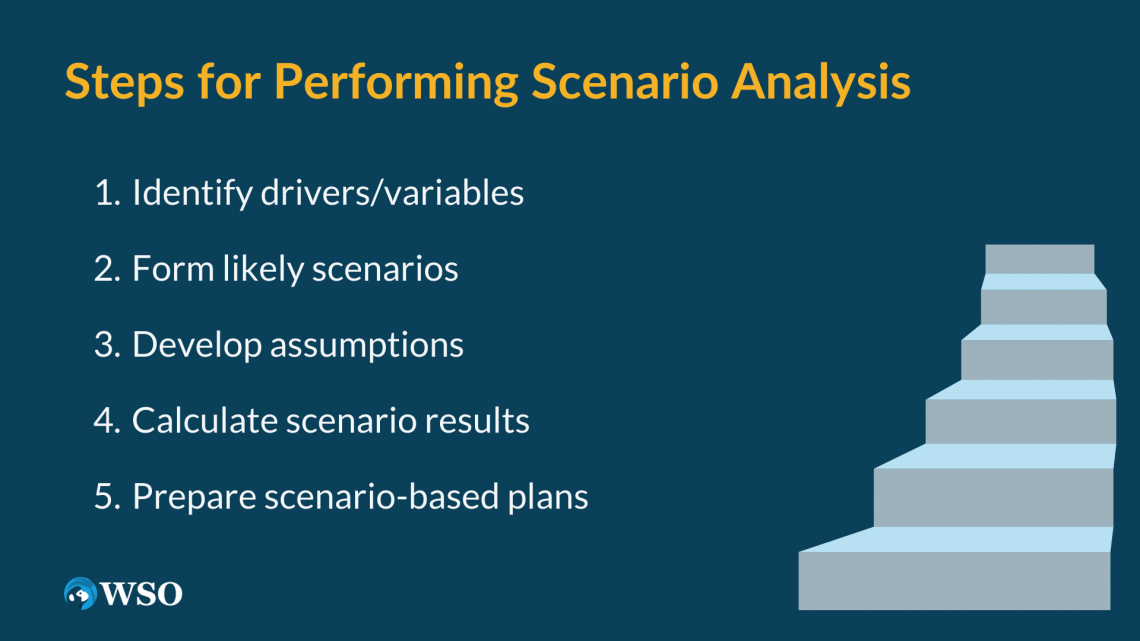
The five steps to perform scenario analysis are:
- Decide what the drivers and/or variables of this analysis are, where drivers refer to the elements in a model that have the potential to affect the outcomes.
- Start forming likely scenarios (events with a high probability of occurring). Many of the variables that have been identified may interact in ways that will produce a specific outcome. Of course, with all these variables, there is a range of values that would fit into the base-case, which is what we use to find the higher probability scenarios.
- Develop assumptions and experiment with changes in variables for each scenario. Analysts will typically focus on the drivers that have large impacts on the result of the model. Using past and current data will help form these assumptions and test out the changes.
- Calculate the results for all the scenarios. This part will likely include the use of financial modeling and the assumptions from previous steps to make the best forecast.
- Prepare plans for the scenarios. The final step is to use the scenario analysis results to form actionable steps by devising the best course of action for these events and making the best decisions in case any of the circumstances come true.
For a great example of how to do scenario analysis, check out the video below from our free video lesson from our Financial Statement Modeling course.


How to Perform Sensitivity analysis?
There are two main types of sensitivity analysis: a local and global sensitivity analysis. The local version refers to changing one variable at a time to see its impact on another variable, which is why this method can be referred to as the one-at-a-time (OAT) method.
On the other hand, global sensitivity analysis simultaneously involves varying variables and conditions to deal with complex cases.
Global methods are better suited to non-linear methods where the change in one assumption leads to a larger or smaller variance in the resulting variable that is not proportionate to the initial change.
Using Monte Carlo methods, which are essentially computational algorithms that repeatedly use random sampling to determine numerical results, would help perform this type of analysis.
However, you would typically use a tool other than excel, so this would require some time to become skilled in using these tools.
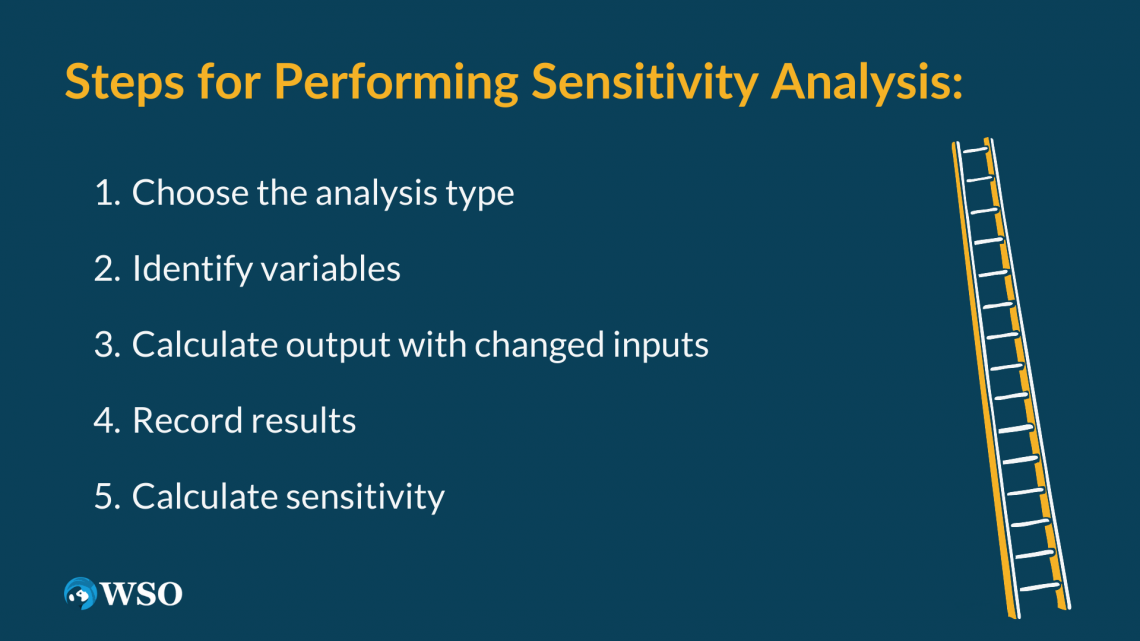
The steps are:
- Define the model's base case, which could be the result you arrive at after performing some form of financial modeling, like a DCF model.
- Identify which variable will be measured as the output of the model and the input variables that will be changed to analyze the effect on the result (these should usually have a direct relationship with the output variable).
- Calculate the output variable using an input variable that has been changed, leaving all other assumptions unchanged. This allows you to isolate the effect of individual variables. An example of this could be increasing the selling price of units by 10% and seeing how this changes net profit.
- Repeat the previous step for all input variables and record the results.
- Calculate the sensitivity for each calculation by dividing the percentage change in the output variable over the percentage change in the input variable
Our Financial Modeling Course also includes lessons on sensitivity analysis, such as this video:
When to use which one?
There is no straightforward answer to this question. It depends on the problem at hand.
Let's say you are interested in evaluating the risk of a project not being completed with variable costs. In this case, you would do sensitivity analysis because it involves looking at one factor (variable costs) and its effect on the project.
On the other hand, scenario analysis might be more appropriate if you are trying to analyze how many units of a product must be sold before the business will break even. It is not enough to look at each variable in isolation as each of them will be related to another.
For example, the price and demand of the product are highly correlated, especially for elastic price commodities. Hence, it would make sense to account for overall future scenarios and then use expected values for each variable.
Although there are cases where sensitivities can be used in place of scenario analysis, it is still best to explore both methods with other additional forms of analysis (like comparable analysis) to provide a complete picture.


More about Financial Modeling
To continue learning and advancing your career, check out these additional helpful WSO resources:


or Want to Sign up with your social account?