Sensitivity analysis: What is it?
A Guide to Mastering Sensitivity Analysis in Financial Modeling


What is Sensitivity analysis?
Sensitivity analysis is a technique that helps us analyze how a change in an independent input variable affects the dependent target variable under a defined set of assumptions. It is also known as what-if analysis or simulation analysis.
It is widely used in several fields requiring analysis, from biology and engineering to finance and economics.
Every model has an overall level of uncertainty arising due to various assumptions, which may or may not hold up in the future. Sensitivity analyses help us identify and account for uncertainty arising due to the use of these assumptions.
It is also helpful in studying black-box models, which cannot be otherwise studied or analyzed due to high levels of complexity.
The video below demonstrates the practical application of such analysis using the "What-If Analysis" tool in Excel. We see how the tool works by testing for different values for gross margin and sales growth rate and how the changes can further impact the share price.
It also illustrates how, while using the What-If Analysis, Excel performs thousands of calculations and, thus, its high computational cost.
- Sensitivity analysis helps identify how changes in independent variables impact the dependent target variable under given assumptions.
- It is a valuable tool for managing uncertainty and understanding cause-and-effect relationships in models.
- Sensitivity analysis aids in decision-making by providing a holistic view and identifying key variables that affect outcomes.
- The analysis can be time-consuming and complex for models with many inputs, and it may overlook multicollinearity between variables.
- Variance-based sensitivity analysis is a probabilistic approach that breaks down output variance into contributions from different inputs, allowing for a global view of sensitivity.
Advantages of sensitivity analysis
This analysis results in a range of values based on assumptions and a range of input values, the primary application of which is to analyze how sensitive the dependent variable is to changes in the independent variables.
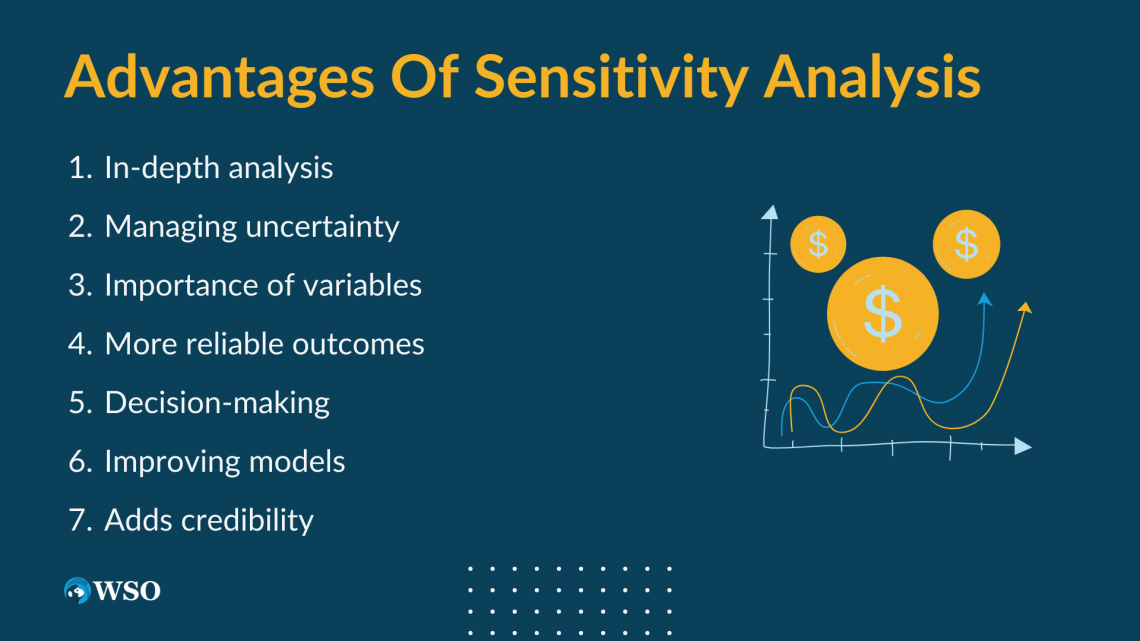
It is a useful tool for many good reasons:
- In-depth analysis: What-if analysis studies the relationship between the independent and the dependent variables. It also studies the sensitivity of the dependent variable to changes in independent variables. In doing so, the cause-and-effect relationship is established, which helps to improve the conclusions drawn from the model.
- Managing uncertainty: Models are rife with uncertainty. Simulation analysis aids in identifying, attributing, and analyzing the effects of uncertainties from different sources in a model.
- Importance of variables: Users can determine the importance of different independent variables depending on how sensitive the output is to them. They can then focus on the key variables to work towards the best possible outcome.
- More reliable outcomes: Studying inputs and their effects on the outcome thoroughly can help in making predictions that are more consistent and reliable.
- Decision-making: Simulation analysis helps make predictions backed by data as a wide range of possible inputs and outcomes are studied. This provides decision-makers with a holistic picture, thus helping better decision-making.
- Improving models: A thorough analysis of the inputs can help identify and fix the model's shortcomings to make it more reliable. It lays out the limitations and the scope of a model, thereby helping fix errors. It also helps verify whether the underlying assumptions behind the model are sound.
- Adds credibility: Testing models with wide input ranges adds credibility to models and predictions.
Disadvantages of sensitivity analysis
Like all analytical methods, sensitivity analysis is not without its drawbacks.
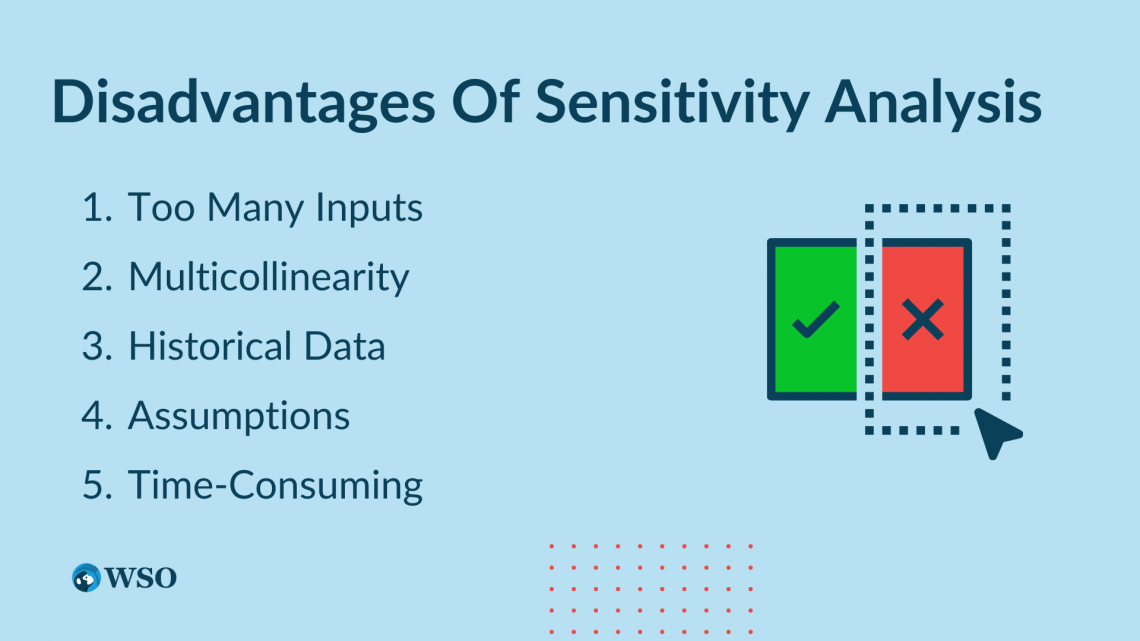
Some of the disadvantages are:
- Too many inputs: Some models can be extremely complex, making analysis of the relationships between each input and the output infeasible. Screening may reduce the dimensionality (by reducing the number of inputs) before running a what-if analysis.
- Multicollinearity: This analysis ignores the interrelationship between the independent variables. For instance, outcome m may depend on variables x and y, which may be correlated. However, these variables will be examined separately under simulation analysis, and their correlation will be ignored.
- Historical data: It uses historical data to establish relationships. However, that leaves plenty of room for errors, as it may not be a good way to make estimates for the future. In addition, there can be new external factors that did not impact the relationship in the past but may impact it going forward.
- Assumptions: We must make assumptions since it is based on historical data. The assumptions may not be rationally sound at times, so they must be verified before being used in the model.
- Requires time: Running the simulations requires a lot of time and computing resources. Accelerating the model and reducing the number of runs can reduce the total time. This can be achieved through metamodels, also known as emulators.
Sensitivity: How is it measured?
We have understood that the simulation analysis determines the sensitivity of the output to changes in inputs, but how do we do that?
Below are the steps to measure sensitivities:
- Determine the base case output.
- Change an input variable by a certain percentage.
- Determine the percentage change in the value of the output.
- Compare the change in output to the change in the input. This is done by dividing the percentage change in the output by the percentage change in the input.
For example, let's consider a 10-year annuity with annual payments of $100 and a discount rate of 8%.
- In the base case scenario, the NPV of the annuity is $671.
- Now, the number of years is reduced by 10% from 10 years to 9 years.
- The new NPV would be $624.69. The percentage change in NPV is 6.9% (($671 - $624.69) / $671).
- The measure of sensitivity would be calculated as 6.9% / 10% = 0.69 or 69%.
This process is repeated to obtain the measure of sensitivity for each input while keeping all the other inputs the same. A higher measure of sensitivity for an input implies that the output is more sensitive to changes in that input.
Example of sensitivity analysis
Abe operates a fast-food franchise on a busy street. He would like to understand the impact of footfall on sales of a particular item. He observes that total revenue from that item depends on the price and volume sold.
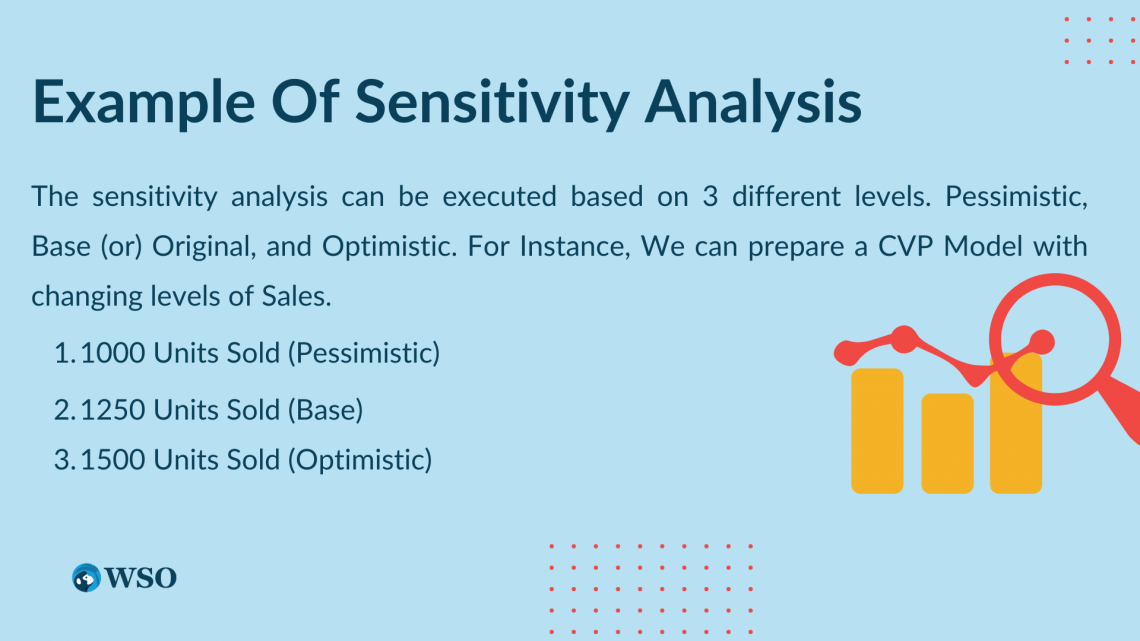
The item's price is $2, and he sells 100,000 units on average every year, which means that annual sales from that item amount to $200,000. He further concludes that a 15% increase in footfall increases the sales volume by 10%.
Based on his observations, he makes a three-statement model. He then incorporates what-if analysis in his financial model to answer some what-if questions. For example, what affects total sales if footfall reduces by 20%? What happens to the total sales figure if the price increases by 10%?
The model can answer such questions for him. Abe can tell that a 10%, 50%, or 100% surge in footfall could translate into a hike in sales by 6.67%, 33.33%, or 66.67%, respectively.
The measure of sensitivity is calculated as the percentage change in the output divided by the percentage change in the independent variable, i.e., 0.67 (= 10% / 15%). The analysis shows that revenues are quite sensitive to fluctuations in footfall.
Based on this information, Abe may decide to reduce the prices to boost revenues further during surging footfall or increase the prices, which might reduce overall revenues but boost margins.
Sensitivity analysis in decision-making and decision trees
Decision-makers need a comprehensive view of all information before making any significant decision. For that, they often rely on what-if analysis. It is imperative to know how deviations from planned inputs can impact the outcome. Reruns of the analyses are crucial in obtaining all the information necessary to make informed decisions.
It helps in understanding not only the uncertainties that are inherent in a model but also its scope and limitations. It also points out the pros and cons of a model. Besides, uncertainty is an inherent part of decision-making.
Therefore, pinpointing the degrees of uncertainty from various sources is vital to making informed decisions. One of the common ways to factor for it is to use probability-weighted expected values in place of uncertain inputs before running a simulation analysis.
A decision tree is a tool that allows users to represent the decision options and their respective probability-weighted outcomes visually and explicitly. It is a useful tool to derive strategies to achieve given objectives. The outcomes having a certain probability of occurrence are known as chance nodes.
To get to the chance nodes, users need to make some decisions. These nodes are called choice nodes or decision nodes.
Decision trees can sometimes be very complex. However, they make the decision process very clear by clarifying the series of decisions necessary to reach the desired outcome.
Once the decision tree analysis is complete, users can implement scenario analysis. Using scenario analysis in a decision tree shows how dependent the strategy is upon probability factors. This way, users can assess the quality of a decision tree analysis.
Sensitivity analysis: Approaches
There are multiple approaches to using what-if analysis. Each approach has its pros and cons. However, they primarily differ in the calculation of the measures of sensitivity.
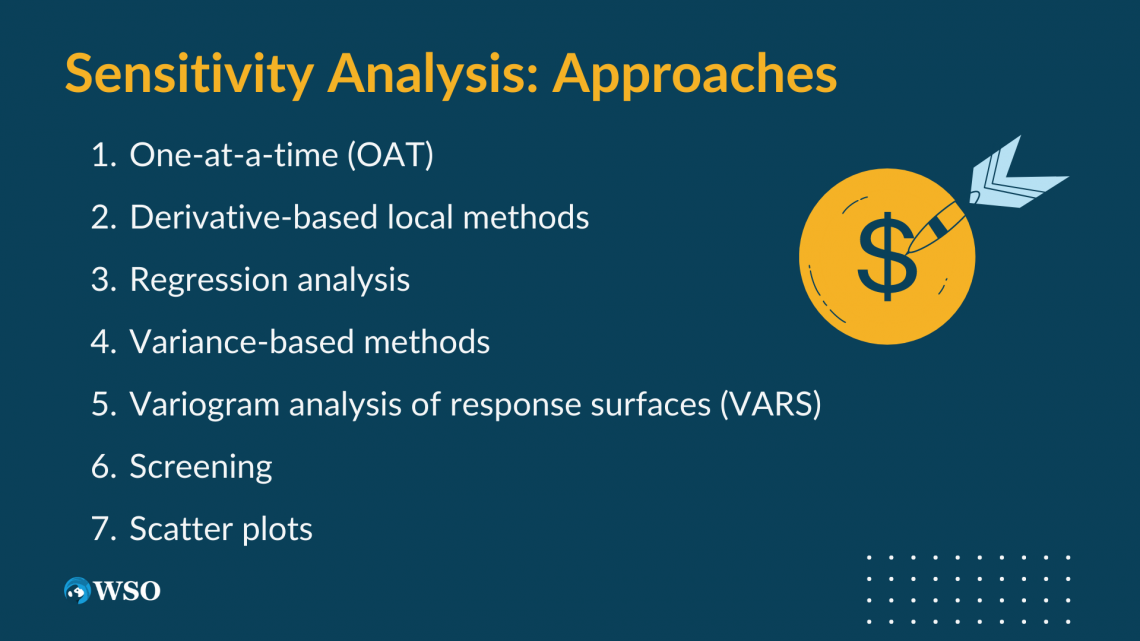
The most common approaches are below.
One-at-a-time (OAT)
It is the simplest and most used approach. It involves changing the value of one input factor at a time and observing its effect on the output. The process involves the following steps:
- Change one independent variable while keeping all the other variables at their base values.
- Readjust the value of that independent variable back to its base value and repeat the process with other independent variables.
This process is repeated until the effect of the changes in all independent variables has been observed. Sensitivity is then determined by examining the changes in the output by using linear regression or partial derivatives. This is a simple approach as by changing one variable at a time, users can unmistakably track the impact of those changes.
However, what makes this approach so simple is also its biggest pitfall. It does not explore the impacts of simultaneous changes in inputs. It also fails to detect multicollinearity between the independent variables. This makes it unfit for nonlinear and multifactor models.
Regression analysis
Regression analysis is another simple approach to what-if analysis. It has a few variations (linear, nonlinear, and multiple linear) which may be used depending on the use case. The regression coefficients are directly used as the measures of sensitivity.

Simple linear and multiple linear regression analyses are the most used variations. In contrast, nonlinear regression is used for complex data where the independent and dependent variables demonstrate a nonlinear relationship.
Since multiple regression tests for the relationship between a dependent variable and multiple independent variables, users must ensure the absence of multicollinearity, i.e., independent inputs should have zero to very low correlations among them.
If they are highly correlated, the effect of the independent variables on the dependent variable will be difficult to assess.
Although this approach can evaluate different types of relationships between the inputs and the output, it is ideally used when the model is linear. The regression must be linear; otherwise, it can be problematic to understand what the standardized coefficients are implying.
The Capital-Asset Pricing Model (CAPM) and the subsequent asset pricing models based on the CAPM (like the Fama-French model) are built on regression analysis. While the CAPM employs linear regression analysis, the Fama-French model employs multiple linear regression.
Another common use of regression analysis in finance is in forecasting financial statements. Multiple regression analysis might be more suited to determine the impact that changes in model drivers will have on revenue and expenses.
Variance-based sensitivity analysis
It is often called the Sobol indices or the Sobol method. It works in a probabilistic framework and breaks down the variance of the output variable of the model into parts which are then attributed to independent inputs or sets of independent inputs.
A variance-based analysis is useful for a variety of reasons.
- It gauges sensitivity through the entire input space; thus, it is a global method.
- It can work with nonlinear model responses.
- It can also quantify the effects of interactions in non-additive models.
Let's assume a model with two inputs (x and y) and one output (m). Using variance-based analysis, a user might discover that 40% of the total variance in m results from x, 50% results from y, and the remaining 10% results from interactions between x and y.
The percentages are directly used as the sensitivity measures. Other approaches to simulation analysis include:
- Derivative-based Local Methods
- Variogram Analysis of Response Surfaces (VARS)
- Screening
- Scatter Plots
Sensitivity analysis vs. Scenario analysis
Scenario analysis helps users assess various outcomes under different scenarios, as the name suggests, ranging from the best-case scenario to the worst-case. It produces a range of outcomes by altering more than one independent variable at the same time to analyze the overall situation.
Therefore, the purpose is to study the range of outcome scenarios. It is done to find out what possible outcome scenarios look like, say, for a farmer, if the tax regime and the weather conditions change for the worse at the same time.
What-if (sensitivity) analysis also produces a variety of outcomes, so what's the difference?
Unlike scenario analysis, what-if analysis tweaks one input at a time to observe its effects on the outcome. Here, the purpose is to study the effects of each of the input variables on the target variable.
For example, a What-if analysis would be conducted to analyze separately what impact the weather conditions and the tax regime have on the farmer's earnings.
Even though both analyses work similarly by altering inputs, they have different purposes and workings. Using both tools can provide users with a broader view of future outcomes.
Please refer to this webpage for a detailed breakdown of the differences between the two.
Sensitivity analysis – Model template
To help our readers understand this topic better, our finance experts have created a template for this kind of analysis. We believe that a more hands-on approach will help you better understand the topic.
Download WSO's free financial modeling templates below! This template allows you to build your table to demonstrate the effect of various variable changes on the outcome.
It is plug-and-play, and you can enter your numbers or formulas to auto-populate output numbers. It also includes other tabs for other elements of a financial model.

Free Resources
To continue learning and advancing your career, check out these additional helpful WSO resources:


or Want to Sign up with your social account?