Financial Forecasting
Learn what financial forecasting is, how it helps businesses plan for the future, and the key methods used, including traditional, rolling, predictive, and qualitative models.


What is Financial Forecasting?
Financial forecasting refers to the process of projecting a company’s expected future financial and operational performance based on historical data and current market trends.
Having a financial forecast is like using a roadmap for your business. It helps you see where money will come from, how much will be spent, and what your company’s financial position might look like down the line.
Businesses can use a financial forecast to answer questions like, “How much revenue might we earn this year?” or “Will we have enough cash to pay bills next quarter?” Quantitative data and analysis support these answers, not just wishes and desires.
One common method of forecasting is through the use of pro forma statements.
Using current information and assumptions, pro forma financial statements are projections made to show how a potential change in the business could affect its future financial status.
Examples of pro forma statements include:
Companies can project many important financial measures, such as revenue, net income, SG&A (Selling, General, and Administrative expenses), inventory, and cash balance.
Internally, forecasts help with planning, financial management, and smart resource allocation. Externally, strong forecasts attract investors by showing financial stability and growth potential.
This makes forecasting a valuable tool for both operational efficiency and building confidence.
- Financial forecasting is when businesses predict how they will perform in the future based on their past performance. It helps the company understand its current position and what could happen next.
- Forecasting is useful for internal purposes, such as financial planning and making better financial decisions, and for external purposes, such as building investors' trust.
- Traditional, rolling, predictive, and exception-based forecasts are all valuable methods in the forecasting process.
- There are quantitative models and qualitative models for forecasting.
- To mitigate some of the limitations, forecasts should be regularly updated to reflect the latest information and assumptions.
Uses of Financial Forecasting
Let’s explore how businesses use financial forecasting in detail:
- Budget Planning: Budgeting and financial forecasting walk together, where budgets are representative of realistic future states. Forecasting gives businesses a glimpse into the future regarding finances, making it possible for better-informed resource allocation.
- Setting Realistic Business Goals: Forecasting shows companies what may happen in the future: growth or decline. It allows companies to set realistic fact-based goals instead of relying on speculation.
- Making Informed Decisions: Businesses can make wiser and data-based financial decisions using historical data and projected trends.
- Reducing Risks: Thinking ahead can lower risk and better position the firm for the future. Forecasting can help prevent overspending and bad decision-making.
- Attracting Investors and Lenders: Investors and lenders may want to see the potential future performance of a business before making decisions. A strong forecast shows that a company is planning and managing wisely, which helps build trust and confidence.
Types of Financial Forecasting Methods
A company’s management decides the type of financial forecast to use. While some companies are good for using just one method, others may want to use multiple methods together.
As a company grows, its structure might change, and it has to deal with more data inputs, all of which should be considered when determining which method to use.
A good forecast should use detailed data and financial results, look ahead to the future, and consider different scenarios and how they might affect the business.
Let’s look at different types of financial forecasts:
Traditional Forecast
Traditional forecasts rely on historical financial data and results to create a fixed projection within a fixed time frame (e.g., January to December). It assumes that past trends will continue unchanged into the future.
As a result, it’s not very adaptable to unforeseen events like disasters and economic recessions. If unexpected changes happen, companies often need to build an entirely new model, as adjustments to the original projection are difficult to make.
Note
Despite its limitations, this type of method is still widely used. It can be used to project various financial items such as revenue, cost of goods sold (COGS), net income, etc.
Rolling Forecast
This method addresses the limitations of traditional forecasting. A rolling forecast continuously takes in new period data and drops outdated periods as they pass.
The model is updated periodically according to the company schedule. It can be updated every day, every week, every month, or every quarter. This allows a company to account for unexpected events without needing to build a new model.
The dynamic nature of this method creates a picture of a company’s current financial situation, helping companies make better management decisions and quickly adjust to changes.
Predictive Forecast
Predictive forecasting uses advanced analytics, such as machine learning and statistical modeling, to predict future financial performance.
Advanced tools can uncover insights that may have been missed using the previous forecasting methods, especially in complicated situations that are difficult to handle manually.
Predictive models use past financial data to create and validate a model that can be used to predict future results. They often use algorithms for data analysis. For example, the k-means clustering method groups similar items together based on their features, helping to find patterns.
Other common algorithms include the random forest algorithm, the mean-shift clustering model, and the neural networks.
To learn how to implement machine learning within a forecast, look into the following course.

Exception Based Forecast
This method uses scenario analysis to create a forecast that can be adjusted based on various possible events.
It also allows management to understand what the company’s financial results might be under different situations.
Types of Forecasting Models
A number of forecasting models can be applied to the financial forecasting process. The two main categories of those models are quantitative and qualitative.
Quantitative
Quantitative forecasting uses numerical data and mathematical formulas to make predictions. These models can produce highly accurate projections because they rely on actual data rather than management desire.
These models are often built using Microsoft’s Excel software.
Straight Line Method
Straight line forecasting takes the historical growth rate to predict future financial performance. It assumes a constant growth rate over time.
For example, if a company had a 10% growth rate in revenue, this method assumes that future revenue will continue to grow at the same 10% rate.
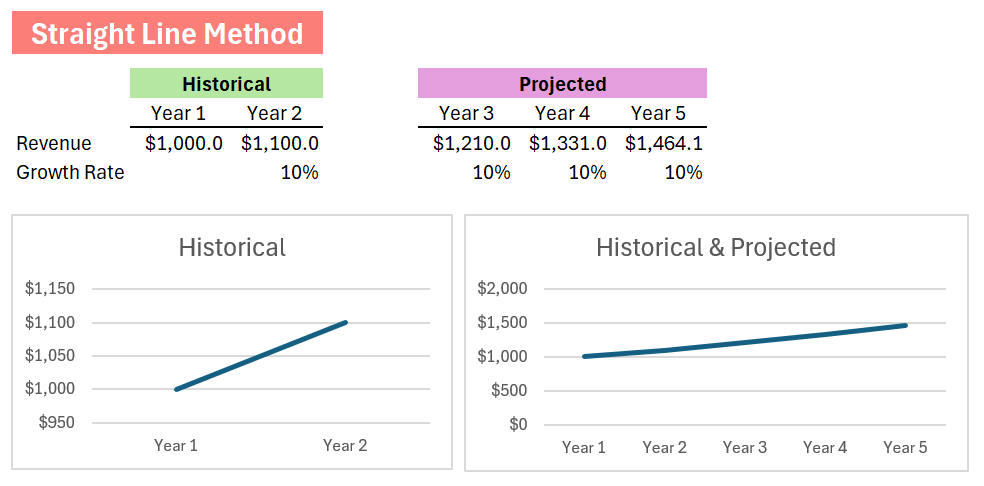
Growth rate is the percentage change in a value from the prior year to the current year, calculated as:
Growth rate = (Current year result/Prior year result) - 1
To project into the future, multiply the prior-year result by 1 plus the growth rate.
Note
A big disadvantage of this method is its assumption of a constant rate over time, which is rare. Also, choosing the appropriate time period for analysis can be challenging. The company needs to use the most relevant historical data for accurate predictions.
Moving Average Method
The moving average method smooths out data fluctuations to better see the trends over a period. It takes the average of historical data to predict.
It’s most useful for short-term forecasting. Common options include 3-month and 5-month moving averages, but businesses can adjust the period based on their needs.
To understand, take a look at the example of Moving Average:

This method is helpful for identifying trends in key financial measures such as net income, cost of goods sold (COGS), or new subscriptions.
Note
To calculate a 3-month moving average, take the data average from the most recent 3 months. To calculate a 5-month moving average, take the data average from the most recent 5 months.
Regression Method
The regression method is useful for studying the relationships between variables to predict outcomes.
There are two types: simple and multiple.
Simple linear regression models the linear relationship between one independent variable (on the X-axis) and a dependent variable (on the Y-axis).
After data points have been plotted on the graph, a line can be used to illustrate a trend or pattern observed.
Let’s take a look at an example of Linear Regression:

Multiple linear regression explores the relationship between a dependent variable and two or more independent variables. Since it considers more factors, it contributes to a better estimate.
For instance, a company can use multiple linear regression analysis to analyze the relationship between net income (dependent variable) and independent variables like the cost of advertising and the cost of labor.
Qualitative
Numbers alone don’t always capture the whole picture. Many factors are difficult to predict using numbers and data, such as geopolitical events and leadership decisions.
Qualitative forecasting relies on people’s opinions and experiences rather than mathematical formulas or models. While these methods are more subjective, they could also provide useful insight and account for factors that are hard to quantify.
Delphi Method
As a qualitative method, the Delphi method doesn’t create a model based on any mathematical formulas.
The Delphi method involves a large group of experts answering questions proposed by a company. The goal is to get a consensus of opinions.
All participants remain anonymous throughout the process to encourage open ideas and reduce biases, such as the “bandwagon effect.”
A facilitator sends out questionnaires to the experts, collects their responses, and compiles the answers into a summary. After each round of questionnaires, experts can review the summary and, if wanted, change their previous answers based on others’ answers.
This process is usually repeated over several rounds until the group reaches a consensus. It’s believed that with each round, the range of opinions will narrow and converge toward the right answer.
The Delphi method is based on the concept of ‘wisdom of the crowds,’ suggesting that people collectively make smarter decisions in larger groups than in smaller groups or individually.
Limitations of Financial Forecasting
Financial forecasts are powerful tools, but they have limitations:
- Dependence on assumptions: Forecasts are based on future scenarios, such as market trends or economic growth. If the assumptions are incorrect, the forecasted outcomes may be inaccurate.
- Unforeseen events: Unexpected events such as political conflicts and regulatory changes can significantly impact forecasts, like the financial crisis of 2008 or the COVID-19 global pandemic.
- Bias in forecasting: Personal or company biases can affect results and reduce the objectivity of forecasts.
- Time frame limitations: Long-term forecasts are often less accurate than short-term ones because there’s more uncertainty over longer periods.
Financial Forecasting vs. Financial Modeling
Although financial forecasting and financial modeling have many similarities, which often leads people to think of them as the same, they are quite different.
Here, we have brief descriptions of the two and their differences:
| Aspect | Financial Forecasting | Financial Modeling |
|---|---|---|
| Definition | Process predicting future outcomes based on historical data | Part of forecasting involving data and financial analysis |
| Goal | Prepares a company for the future by estimating key metrics like revenue or costs | Helps a company make better decisions |
| Involvement of Data | Involve data analysis | Involve data analysis and financial analysis |
| Use Cases | Budgeting, setting financial goals | Valuation, M&A analysis, raising capital, budgeting |
| Types of Models | Straight line method, moving average method, linear regression method, Delphi method | Unlimited types Common ones include: Straight line method, moving average method, linear regression method, Delphi method, discounted cash flow (DCF) model, and three-statement model |
| Output | The expectation for a company’s future outlook | Detailed statements and analyses that can be used in various scenarios |
| Implementation | strategic or operational changes based on results (e.g., budget adjustments) | Used to assist management and decision-making, such as optimizing investments or setting financial targets |
Financial Forecasting FAQs
Financial forecasting helps make decisions about business planning and operations management. It can predict future performance and inform decisions on hiring, marketing, use of resources, and whether to fund new projects.
It helps the business to set realistic goals, reduce risk, and build relationships with investors.
The two common models are:
- Quantitative method: straight-line method, moving average method, simple and multiple linear regression method
- Qualitative method: Delphi method
Forecasts should be updated regularly, with the frequency depending on business needs and market conditions. Many businesses forecast monthly or quarterly to ensure operations stay on track.
Annual forecasting is ideal for stable industries, long-term planning, and yearly budgets. More frequent ones, like daily or weekly forecasts, may be needed during periods of volatility or significant changes in operations.
Budgeting sets specific goals, like sales or earnings targets, for a certain period of time. These goals are usually set based on past trends and experience. Budgeting points out the direction management wants the business to go.
Financial forecasting looks at a company's current financial situation and predicts whether those goals can be met.
While budgets are created periodically, forecasts are updated more frequently to assess progress. Budgeting focuses on planning, whereas forecasting emphasizes evaluation and adjustment.
Free Resources
To continue learning and advancing your career, check out these additional helpful WSO resources:


or Want to Sign up with your social account?