Independent Variable
A variable in a scientific experiment or an experimental study manipulated or controlled by the researcher.


What Is An Independent Variable?
An independent variable (IV) is a variable in a scientific experiment or an experimental study manipulated or controlled by the researcher. It is called "independent" because other variables do not influence it in the experiment.
It is important to carefully control this variable in an experiment to isolate its effect on the dependent variable. If it is not carefully controlled, it could affect the results of the experiment and make it difficult to accurately determine the relationship between the two variables.
There can be multiple IVs in an experiment, and they can be either continuous (such as temperature) or categorical (such as different types of fertilizers).
Researchers must carefully consider the potential effects of all these variables in their experiments and ensure they are properly controlled.
These variables are essential to scientific experimentation, as they allow researchers to study the relationship between variables and determine cause-and-effect relationships systematically.
By carefully manipulating and controlling these variables, researchers can gain a deeper understanding of the natural world and contribute to the advancement of scientific knowledge.
For example, if a scientist is studying the effect of temperature on the rate of photosynthesis in plants, the IV would be temperature. The scientist would manipulate the temperature by controlling the environment where the plants are grown while measuring the rate of photosynthesis as the dependent variable.
- An independent variable is a variable manipulated or controlled in an experiment or statistical analysis to observe the effect on a dependent variable.
- The relationship between the two variables can be visualized using a scatter plot or other graphs.
- It's important to identify the key independent variables likely to impact the dependent variable and make assumptions about how they will likely change.
- When analyzing data, it's important to consider the potential impact of other variables that may confound the relationship between the two variables.
Features of Independent Variables
Several key features of these variables are important to consider when designing a scientific experiment.
These features are
- Relevance: The variable should be relevant to the research question and hypothesis being tested. This means that it should be directly related to the dependent variable and have the potential to affect it.
- Manipulability: The variable should be able to be manipulated in a controlled way. This means changing the IV level and keeping all other variables constant should be possible.
- Levels: The variable should have multiple levels that can be tested. This allows the researcher to study the effect of different levels of the variable on the dependent variable.
- Control: The variable should be carefully controlled in the experiment to ensure its effects on the dependent variable can be accurately measured.
- Random assignment: In some cases, it may be necessary to randomly assign subjects to different variable levels to eliminate the potential for bias. This helps to ensure that any differences between groups are due to the variable that is independent and not other factors.
By considering these features of this variable, researchers can design experiments that allow them to study the relationship between variables and test their hypotheses accurately.
Types Of Independent Variable
To understand the concept better, we will look into the two main types of this variable.
These types significantly display the effect of the variable on the experiment. Understanding these helps the researchers to know what type of data they are dealing with. Here we will look into two of the main types. These are:
1. Continuous
These variables can take on any value within a certain range.
Example
The temperature is a continuous IV because it can take on any value within a certain range, such as 0 degrees Celsius to 100 degrees Celsius. Time is also a continuous IV because it can take on any value within a certain range, such as 1 minute to 1 hour.
2. Categorical
These variables can only take on a limited number of values, and these values are usually distinct categories.
Example
Gender is a categorical IV because it can only take on two values: male or female. The type of treatment is also a categorical IV because it can only take on a limited number of values, such as drug A, drug B, or a placebo.
It is important to note that these variables can also be manipulated differently, such as between subjects or within subjects.
Between-subjects manipulation involves assigning different subjects to different levels of the IV, while within-subjects manipulation involves having each subject experience all variable levels.
These variables can also be manipulated differently, such as between subjects or within subjects.
Independent vs. Dependent Variable
In an experiment, the independent variable is often represented by the letter "x," and the dependent variable is often represented by the letter "y."
The relationship between the independent and dependent variables can be expressed in an equation using these variables.
For example, in an experiment to study the effect of temperature on plant growth, the independent variable (temperature) can be represented by "x," and the dependent variable (plant growth) can be represented by "y." The equation for this relationship could be expressed as
y = f(x)
This equation shows that the dependent variable (y) is a function of the independent variable (x), meaning that this variable influences the dependent variable. Therefore, the independent (x) is on the left side of the equation, and the dependent variable (y) is on the right.
In general, the equation for the relationship between the independent and dependent variables can be expressed as follows:
y = f(x)
This equation shows that the dependent variable (y) is a function of the independent (x), meaning that this variable influences the dependent variable.
A table summarizes the main differences between independent and dependent variables.
| Independent Variable | Dependent Variable |
|---|---|
| Manipulated or controlled by the researcher. | Affected by the independent variable. |
| Called "independent" because other variables do not influence it in the experiment. | Called "dependent" because its value depends on the value of the independent. |
| Allows researchers to study the relationship between variables and determine cause-and-effect relationships. | Measured in the experiment to determine the effect of the independent. |
| It can be either continuous (such as temperature) or categorical (such as different fertilizers). | It can be either continuous (such as the rate of photosynthesis) or categorical (such as success or failure). |
As we can see, the main difference between the two variables is that the independent is manipulated or controlled by the researcher. But, simultaneously, the dependent is affected by the independent and measured in the experiment.
How to create an independent variable?
We need to go through different steps to create this variable.
To create these variables in a scientific experiment, you need to follow these steps:
1. Identify the research question and hypothesis
The first step in creating this variable is clearly defining the research question and hypothesis you want to test. This will help you determine what variables to manipulate in your experiment.
2. Select the independent variable
Once you have identified the research question and hypothesis, you can select the IV you will manipulate in your experiment. Ensure choosing a variable relevant to your research question which can be manipulated in a controlled way.
3. Determine the levels of the variable
After selecting the IV, you need to determine the levels of the variable you will use in your experiment.
Example
Suppose you are studying the effect of temperature on the rate of photosynthesis. In that case, you should test a range of temperatures, such as 20 degrees Celsius, 25 degrees Celsius, and 30 degrees Celsius.
4. Manipulate the variable
Once you have determined the variable levels, you need to manipulate the variable in a controlled way.
This might involve changing the experiment's environment, administering different treatments, or using different experimental conditions.
5. Measure the dependent variable
While manipulating the variable, you need to measure the dependent variable, the variable affected by the independent variable.
Example
If you are studying the effect of temperature on the rate of photosynthesis, you would measure the rate of photosynthesis while manipulating the temperature.
To make it short, creating an IV in a scientific experiment involves the following:
- Identifying the research question and hypothesis.
- Selecting the independent var.
- Determining the levels of the variable.
- Manipulating the variable in a controlled way.
- Measuring the dependent variable.
By following these steps, you can design an experiment that allows you to study the relationship between variables and test your hypothesis.
Independent Variable Example
You can use a scatter plot to visualize the relationship between an independent and dependent variable in a graph.
This graph plots the values of two variables on a graph, with one variable plotted on the x-axis and the other on the y-axis. The independent is typically plotted on the x-axis, while the dependent is plotted on the y-axis.
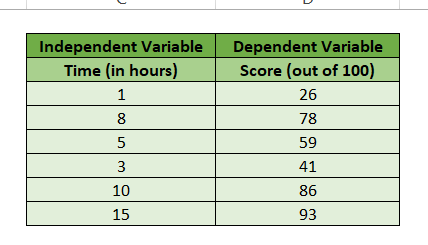
For example, let's say you are researching to examine the relationship between the time students spend studying and their test scores. In this case, the amount of time students spend studying would be the independent, and their test scores would be the dependent variable.
You could create a scatter plot by plotting students' time studying on the x-axis and their test scores on the y-axis.
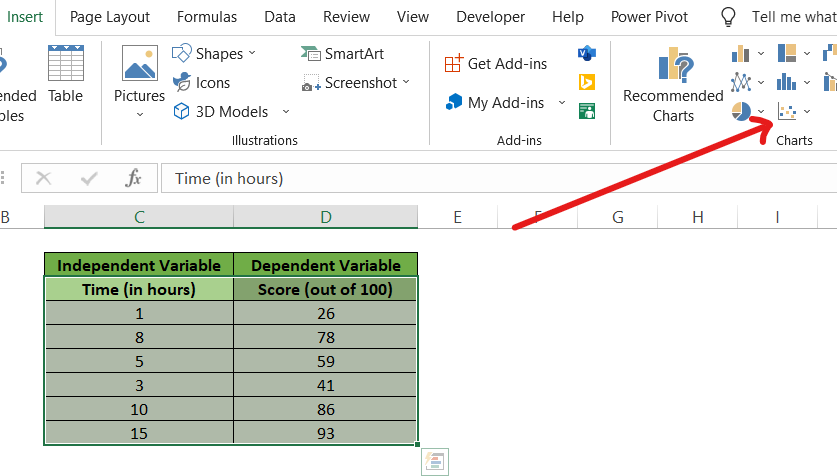
Here's a guide to creating a scatterplot in Excel:
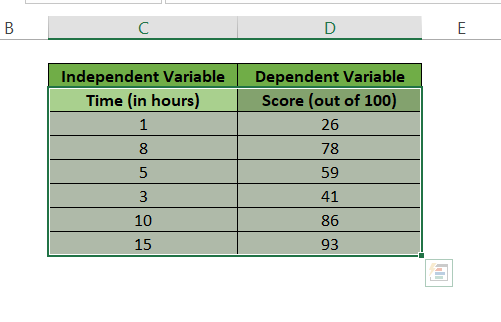
1. Open a new worksheet in Excel.
2. Enter the independent (time) values in column A and the dependent variable (scores) in column B.
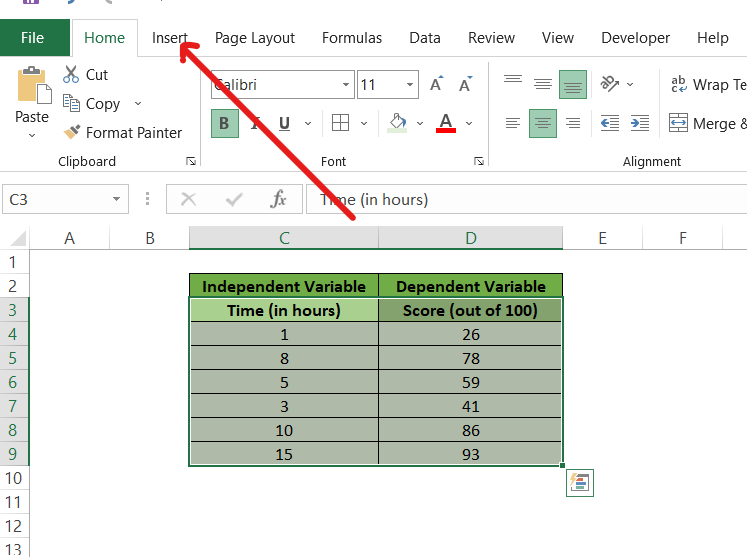
3. Select the data in columns A and B.
4. Click the Scatter chart icon on the Insert tab.
5. Select the Scatter chart type you want to use.
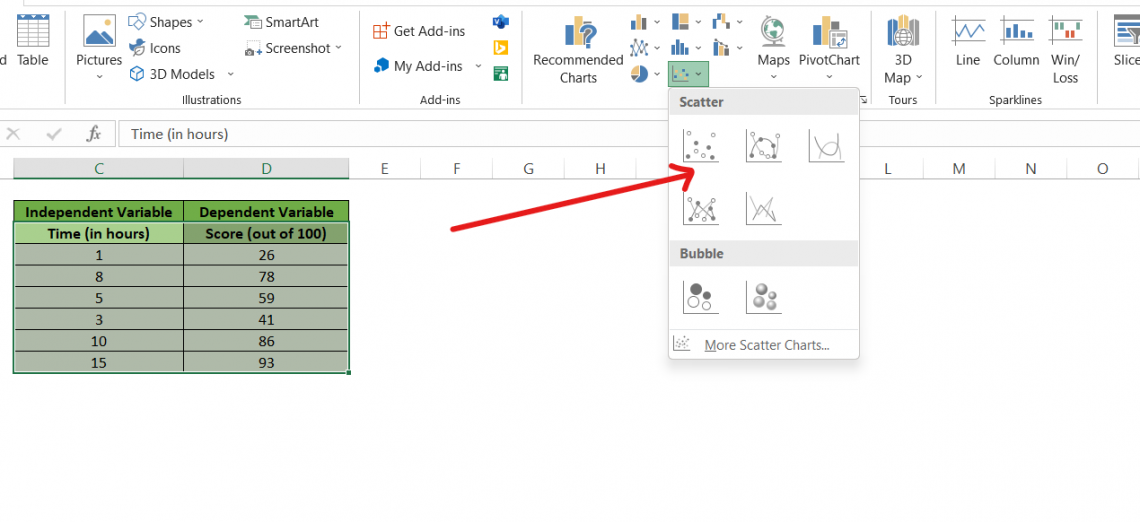
6. The scatter plot will be created based on your entered values.
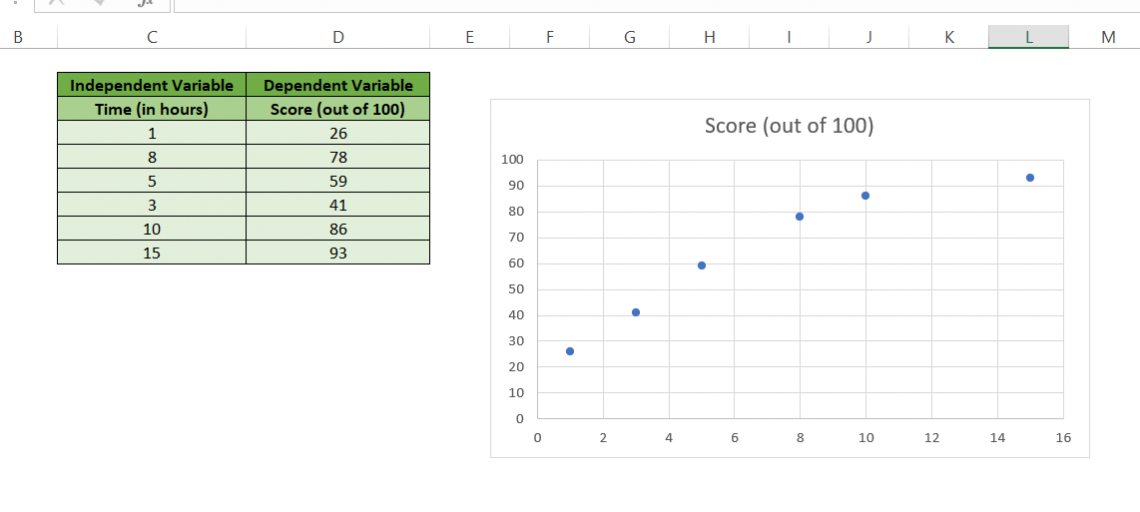
In this scatterplot, the amount of time students spend studying is the variable that is independent and is plotted on the x-axis. The test scores are the dependent variable and are plotted on the y-axis.
The points on the graph represent individual students, and the position of each point reflects the values of the independent and dependent variables for that student.
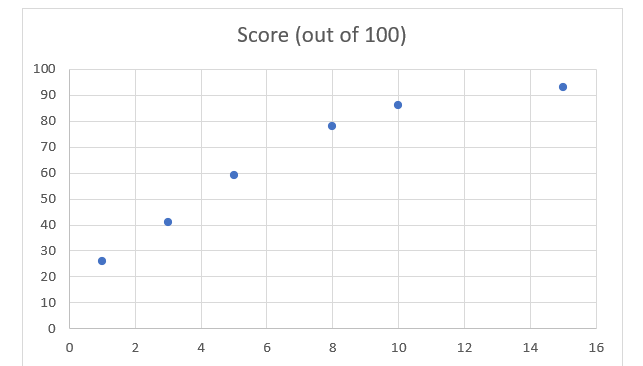
This scatterplot shows a positive relationship between the amount of time students spend studying and their test scores.
In other words, students who spend more time studying tend to have higher test scores. However, it's important to note that this is just an example, and the relationship between the independent and dependent variables in your data may be different.
Conclusion
In a scientific experiment or study, a variable that is altered or under the researcher's control is called an independent variable (IV). The reason it is called "independent" is that it is unaffected by other experiment factors.
To precisely isolate the independent variable's impact on the dependent variable, careful control of the independent variable is essential.
When designing experiments, researchers need to take into account a number of characteristics of the independent variable, including relevance, manipulability, levels, control, and random assignment.
Different manipulations, such as switching between subjects or within subjects, can be applied to independent variables, which might be continuous or categorical. Understanding cause-and-effect relationships requires a grasp of the relationship between the independent and dependent variables.
Finding the study question, choosing the variable, figuring out how much of it to add, adjusting it carefully, and measuring the dependent variable are all steps in the process of creating an independent variable.
Tools like scatter plots, which assist show patterns and correlations in the data, can be used to visualise the relationship between the independent and dependent variables.
All things considered, conducting meaningful experiments and expanding scientific knowledge depend on an understanding of and successful use of independent variables.
Independent Variable FAQs
It is a variable manipulated or controlled in an experiment or statistical analysis to observe the effect on a dependent variable.
To plot this variable, you typically need to use a graph or chart that displays the values of two variables. Typically, on the x-axis, the variable that is independent is plotted, while on the y-axis, the dependent variable is plotted.
The main difference between an independent and dependent variable is their role in an experiment or analysis. For example, the variable that is independent is manipulated or controlled, while the dependent variable is measured or observed.
Several statistical techniques can be used to test the relationship between an independent and dependent variable, including
- correlation analysis,
- regression analysis,
- and t-tests.
These techniques allow you to determine the strength and direction of the variables and test whether the relationship is statistically significant.

Free Resources
To continue learning and advancing your career, check out these additional helpful WSO resources:


or Want to Sign up with your social account?