Nonlinear Regression
An approach to statistical modeling that uses a non-straight line to explain data instead of a straight line


What Is Nonlinear Regression?
Nonlinear regression, also known as a nonlinear model, is an approach to statistical modeling that uses a non-straight line to explain data instead of a straight line.
This opposes linear regression analysis, which uses a straight-line equation (such as Y = ax + b). While linear regression models follow straight lines, nonlinear regression models can represent various curves to explain the relationship between variables.
Nonlinear regression is useful because it is much more flexible than linear regression. The curve can often produce more accurate results for your data and more effectively display the association between variables.
The goal of nonlinear regression analysis is to find the model that best fits the data by finding the curve that optimally represents the relationship between variables.
While minimizing the sum of squares is a common optimization approach, the primary objective is to find the best-fitting curve.
- In contrast to linear regression, nonlinear regression employs non-straight lines to model data, allowing for more flexible representations of the relationship between variables.
- Nonlinear regression utilizes various equations such as logarithmic, exponential, square root, trigonometric, or power functions to fit data, aiming to find the curve that best describes the relationship between variables.
- The accuracy of a nonlinear regression model is often assessed using the sum of squares, which measures the differences between observed data points and the predicted values from the model.
- While nonlinear regression is versatile and valuable for capturing complex relationships, it may struggle with extreme or nonlinear data patterns, potentially leading to unrealistic predictions or overfitting.
- Nonlinear regression finds applications in economics, finance, engineering, and other fields where linear models fail to adequately represent data, enabling predictions of future events or understanding nonlinear dependencies between variables.
How to Model Nonlinear Regression
Nonlinear regressions may use several different equations to fit a dataset. This includes logarithmic functions, exponential functions, square root functions, trigonometric functions, and power functions.
Estimating the correct equation is typically done through a series of iterations aiming to approach the ideal model for the data, often measured by criteria such as the smallest sum of squares, adjusted R-squared, or AIC.
A simple equation for modeling a nonlinear regression curve is as follows:
Y = f(X, β) + ε
where,
- X = A vector of P predictors
- β = A vector of K parameters
- f = A known regression function
- ε = Error term
Nonlinear regression models may be described as a curve that models a vector of parameters multiplied by an independent variable where the graph is nonlinear in the parameters. A parameter is a statistical term referring to the distribution of a particular characteristic of an entire population.
Note
True parameters are often difficult to obtain. Therefore, they are commonly estimated by using a smaller population and inferring about the whole population, such as the mean, median, or mode.
Limitations of Nonlinear Regression
Nonlinear regression has some limitations. While it is beneficial for predicting the relationship between variables, it is not a perfect predictor. The nonlinear regression model is fairly versatile, considering it accommodates nonlinear relationships in data but still may produce unreliable predictions.
Of course, this is exceptionally prominent if the relationship between the two variables changes, or it may not consider other variables that can influence the relationship between the two measured variables.
While nonlinear regression can be useful for creating forecasts and interpreting correlations, it's important to note that its ability to predict future outcomes may be limited by factors such as model complexity and overfitting, not solely by the imperfection of past relationships.
For example, when the trend in the data is not linear, nonlinear regression may struggle to model the relationship accurately.
In particular, the curve generated by nonlinear regression may become too steep for specific data sets, leading to potentially unrealistic predictions, especially in cases of extreme or complex data patterns.
How to Calculate the Sum of Squares
The sum of squares is found by finding the difference between the Y-value of each data point and the Y-value of the mean, squaring the differences, and taking the sum of all the squares of the differences. Hence, the name.
The sum of squares is a value meant to demonstrate the accuracy of a fit curve to a set of data. The differences are squared to emphasize larger deviations from the while penalizing smaller ones equally, contributing to calculating the sum of squares.
The smaller the differences between data points and the fitted model, the smaller the sum of squares will be. This means that the lower the sum of squares, the more the model fits, or the better it is at predicting the relationship between two variables.
Nonlinear models can be a double-edged sword. While this type of regression is often better suited for modeling relationships between variables because it is more flexible, finding the model that best fits the data can also make it challenging.
Note
Often, nonlinear regressions are found through a series of iterations made through trial and error. Two commonly used methods are the Levenberg-Marquardt and Gauss-Newton methods.
Applications of Nonlinear Regression
Nonlinear regression analyzes data where the relationship between variables is not linear. It is most often used when a line does not accurately represent the data, for example, when the relationship between two variables is concave or convex.
Nonlinear regression has many applications in various fields, including economics, engineering, science, and more.
Economists such as Tinbergen and Samuelson have extensively studied the economic theory of nonlinear regression, which has been applied to various problems in macro and microanalysis. In finance, nonlinear regression may be used in several ways.
It is often used to forecast future prices. One form of this takes the form of time-series models, which are commonly used to track the price of an asset or basket of assets over time, usually through certain economic conditions.
However, these models typically do not take on a linear trajectory and are, therefore, graphed using nonlinear regression.
Nonlinear regression is important in engineering applications that involve dynamic systems with time-varying parameters, such as fluid dynamics and control engineering. In these domains, the nonlinearity can come from viscosity or other sources of dissipation in the system.
This type of regression has a range of uses, but the most common is predicting or forecasting future events from past data. For example, the equation can help predict a stock price in two weeks, how many people will buy this pair of shoes next month, and more.
Note
It also helps determine the dependence between variables that may be related in non-linear ways. For example, it can help determine how much money a business needs to spend on marketing campaigns instead of how many new customers it needs to generate.
Example of Nonlinear Regression
It may be easier to understand nonlinear regression curves with an example. So, let's look at a simple example of data that is best modeled with a curve rather than a line: the height of a plant over time.
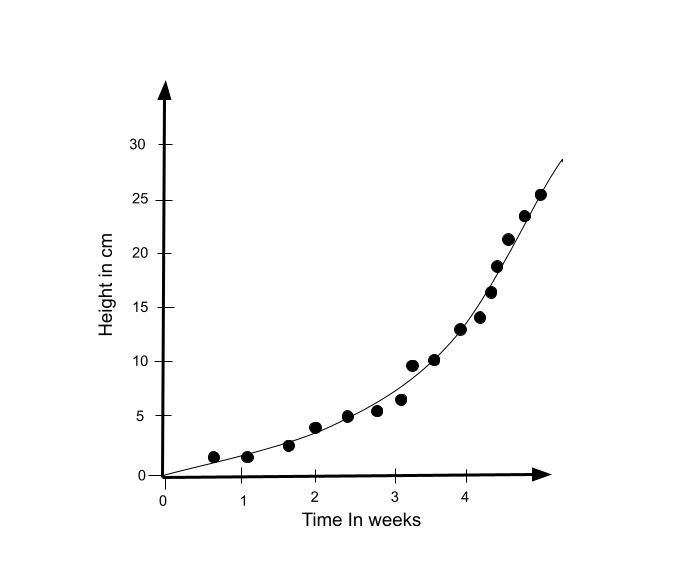
Plants do not grow at a constant rate. In this graph, the dependent variable is the plant's height, and the independent variable is time or the plant's age. As one can see, time progresses at a constant rate.
On the other hand, the plant's height is not constant. The plant grows a different amount every week and tends to grow more over time. This shows that this graph is nonlinear in the parameter, creating a nonlinear curve.
If we accurately understand the relationship in such an instance, it would be unwise to model it using linear regression. As a result, a simple rule of thumb ensures that the model used for predicting the values is based on the underlying relationship.

Free Resources
To continue learning and advancing your career, check out these additional helpful WSO resources:


or Want to Sign up with your social account?