Profit
Learn what profit really means in business, from gross to net income. Explore key formulas, analysis methods, and how profit compares to metrics like EBIT, EBITDA, and cash flow.


What Is Profit?
Profit is the amount a firm retains after deducting costs, such as expenses, taxes, and interest, from its revenues on the income statement.
It measures the firm's profitability and can be analyzed on the income statement at different levels, such as gross, operating, and net profit.
Profitability gives the shareholders more insight into the company’s financial and operational health.
Key Takeaways
- Profit is the amount a firm retains after deducting various costs from its revenues.
- The three primary profit metrics are gross, operating, and net income.
- Vertical analysis examines profit as a percentage of revenue, while horizontal analysis compares profit over different periods or firms.
- Profit can be calculated using a top-down approach (starting from revenue) or a bottom-up approach (starting from net income)
- Profit metrics have limitations; for instance, gross profit is less applicable to service-based companies, and operating income is best used for comparisons within the same industry.
Types of Profit
Firstly, we need to understand that two general approaches can be used to calculate profit.
One is the top-down approach, where you count down starting at the revenue metric, and the other is the bottom-up approach, where you start at the net income and count up from there.
Now, let's understand the different types of profit:
Gross Profit
First, it’s important to understand two significant terms. Revenue and COGS (Cost of Goods Sold).
Revenue is the money the firm receives from selling goods or services. On the other hand, the cost of goods sold shows the costs associated with manufacturing that specific product.
Therefore, gross profit is the amount a firm makes from selling its primary products minus the costs of that product.
The top-down formula is:
Gross profit = Revenue - Cost of goods sold.
The bottom-up formula is:
Gross profit = Net income + Taxes + Interest + Selling general and administrative expenses
An analyst would use gross profit to examine the profitability of the primary products and isolate the noise related to other operating expenses and the capital structure.
Operating Profit
Operating income goes a step further and adds more items to a calculation. These items are wages, marketing, depreciation and amortization, advertising, rent, and utilities. The operating income shows the profit the business generates from its core operations.
Gross profit reflects the earnings from selling products after deducting direct costs, while operating income accounts for additional expenses necessary to sustain operations.
The top-down approach formula is:
Revenue - Cost of goods sold - Selling general and administrative expenses
The bottom-up approach is
Net income + Taxes + Interest
Operating income is often helpful in horizontal analysis when comparing different companies since it doesn't include varying effects of the capital structure.
Net Profit
Net income shows how much money a firm generates after it accounts for all its expenses.
Still, net income also includes the effects of the capital structure and taxes compared to operating income.
The more debt a business has and the riskier the debt, the more interest the firm must pay each period, reducing net income.
The down approach is:
Revenue - Cost of goods sold - Selling general and administrative expenses - Interest - Taxes
Net income can be used to calculate EPS, which indicates how much each investor earns per share, in addition to knowing how much the firm earned.
Applications of the Profit Metric
The three primary profitability metrics are:
- Gross profit
- Operating profit
- Net profit
These metrics can give an estimate of how profitable a specific firm is for a given year.
Still, looking at just one number for one particular year might not be insightful. Special analysis techniques can make the profit more significant.
Both techniques, vertical and horizontal analysis, allow you to compare two financial metrics to gain more insight into a business's performance. Let’s understand these types of analysis below:
Vertical Analysis
Vertical analysis allows a firm to compare how much it retains in percentage after subtracting various costs from revenue.
For example, if the revenue is $1,000 and the net income is $100, the profit margin will be 10%.
The firm retains only 10% when subtracting all of the costs.
Horizontal Analysis
Horizontal analysis tries to give insight into how much, in percentage terms, the firm is growing each period or how its metrics differ from those of other firms (e.g., year, quarter, or month).
For example, if the firm's operating income was $1,000 in 2023 and $1,500 the following year, then using a CAGR formula, we can say that it grew by 50%.
Lastly, comparing growth over three or more years can help us recognize patterns and get an idea of the general direction of growth.
Example of Profit
Let's look at the income statement for the ABC Corporation for the years 2021 to 2023.
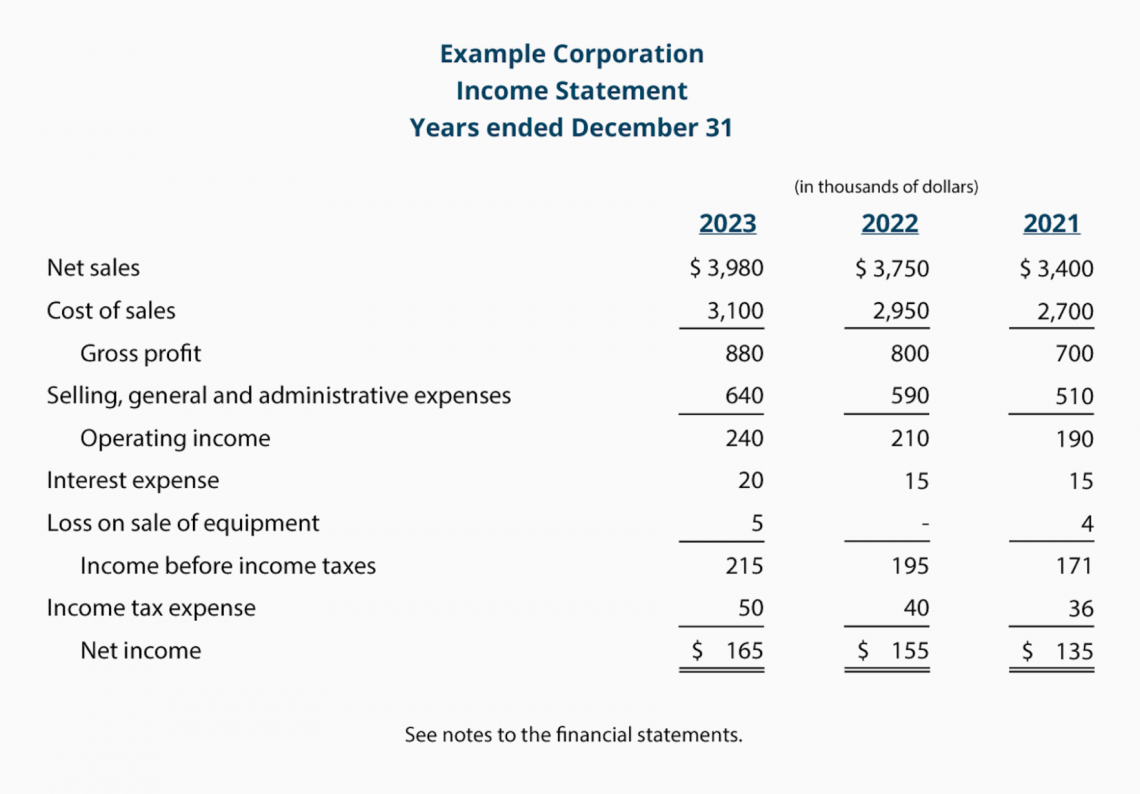
The top of the income statement for 2023 shows that the firm made 3,980 million dollars from selling its primary products, which cost 3,100 million to produce. The gross profit is, therefore, 880 million.
Then, we conduct the following calculations:
Gross Profit - SG&A = Operating Income
880 million - 640 million = 240 million
Operating Income - Interest Expense - Loss on Sale of Equipment - Taxes = Net Income
240 million - 20 million - 50 million = 165 million
We can also analyze the statements. For example, the gross profit margin for 2023 will be 22.11%, while the net profit margin will be just 4.15%.
The analysis exemplifies the difference between revenues and all other expenses over the period.
The horizontal analysis can also be applied to this specific example. From 2022 to 2023, the firm's gross profit increased by 10%, while the net profit increased by 6.5%.
While the analysis shows that the company became more profitable, it also indicates that other items, like SG&A or other operating expenses, have been growing and becoming more expensive. Therefore, they bring less growth.
Operating Profit vs. EBIT vs. EBITDA
EBIT is very similar to Operating Income (OI); both metrics are often identical in company statements.
Still, sometimes, both calculations do differ. The EBIT calculation can sometimes include interest income, income from investments, and other income.
EBITDA is very similar to EBIT. The only difference is that EBITDA adds back depreciation and amortization.
Some analysts think EBITDA is a better operating metric since the depreciation and amortization are non-cash expenses and don't represent actual cash outflows.
Below is the table outlining the primary differences:
| Operating Profit | EBIT | EBITDA | |
|---|---|---|---|
| Excludes | Interest and taxes | Interest and taxes | Interest, taxes, D&A |
| Includes | Revenue and operating expenses | Revenue, operating profit, and non-operating income | All EBIT items, excluding depreciation and amortization |
| Non-Cash Charges | Includes non-cash charges | Includes non-cash charges | Excludes non-cash charges |
Profit vs. Operating Cash Flow vs. Free Cash Flow
While the profit metrics measure the company's revenue each period, they don't show the actual cash it receives.
The income statement items are subject to the standards set by GAAP (Generally Accepted Accounting Principles).
GAAP requires companies to record each metric on the statement when it occurs, but not when the actual cash is received.
While operating cash flow is most similar to operating income, it shows how much cash the firm receives each period from its core operations versus how much it incurs.
Free cash flow is similar to free cash flow but goes further. It subtracts CAPEX and arrives at cash flows that are distributable to all the firm's investors—both equity and creditors.
The key differences are in the table below:
| Profit | Operating Cash Flow | Free Cash Flow | |
|---|---|---|---|
| GAAP vs. Non-GAAP | GAAP | Non-GAAP | Non-GAAP |
| Accrual vs. Cash Accounting | Accrual accounting | Cash accounting | Cash accounting |
| Includes vs. Excludes | Includes interest and D&A but excludes changes in working capital and CAPEX | Excludes interest, D&A, and CAPEX but includes changes in working capital | Excludes interest and D&A but includes changes in working capital and CAPEX |
Profit FAQs
There are several limitations when analyzing profit.
First, gross profit won't apply to service sector companies since they don't have a cost of goods sold; therefore, their gross profit equals revenue.
Also, according to omnicalculator.com, operating income is limited. Since it measures the firm's core operations, it is only valid when comparing firms within the same industry.
One way is the cost accounting approach, which is not widely used.
Instead of grouping everything by function (like in the above examples, e.g., revenue, cost of goods sold, SG&A, etc.), the formula groups everything by nature.
Grouping implies taking the revenue and subtracting the direct and indirect costs.
Here is the formula:
Operating Income = Net revenue - Direct costs - Indirect costs
Net revenue takes the revenue and subtracts all of the discounts and allowances.
At the same time, the direct and indirect costs are directly and indirectly tied to the business's core operations, respectively.
While the firm can have a negative of the three profit metrics, it is generally not a good sign. It implies that the firm has problems.
For the net and operating income, a negative profit sometimes might not mean a bad thing because there could be a non-cash or cash one-time charge that is not consistent over many years.
Still, if the gross profit is negative since it captures the profit from the firm's primary product, it might mean that the idea or product doesn't work or that the business has to go bankrupt.


Free Resources
To continue learning and advancing your career, check out these additional helpful WSO resources:


or Want to Sign up with your social account?