Year to Date (YTD)
Year To Date (YTD) is used in finance and accounting to track a company’s sales or stock value performance, calculate portfolio performance, and more


What Is Year To Date (YTD)?
Year To Date (YTD) is used in finance and accounting to track a company’s sales or stock value performance, calculate portfolio performance, and show the net earnings on a worker’s paycheck stub (the latter is more of an HR function).
It is a valuable metric for comparing a company’s performance relative to previous periods and its peers. In addition, it allows us to compare historical data for financial reporting purposes and identify and analyze trends in performance.
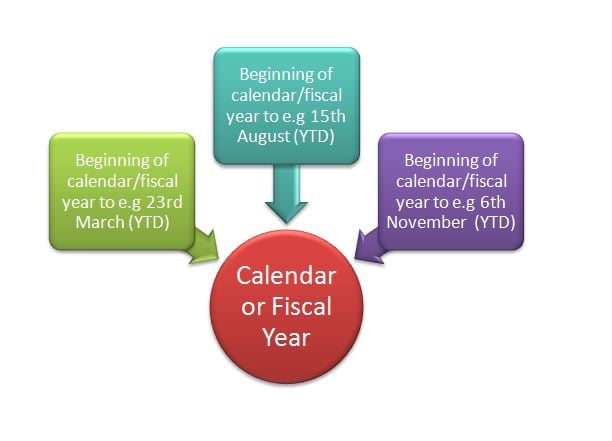
The Year To Date can refer to either the calendar year or the fiscal year. The calendar and fiscal year can be the same but have different start and end dates.
However, according to the IRS, the fiscal year, also called the financial year, can end on any last day of the month except for December.
The fiscal year (FY) is an accounting term typically covering 12 months but can vary depending on the organization’s chosen fiscal year period.
Companies can choose when their fiscal year starts, usually when the first business activities have started or when the company is ready to go into business. The fiscal year for the U.S. federal government runs from 1st October to 30th September.
- Year to Date (YTD) is a crucial business metric, offering in-depth insights into sales, investments, and payroll over specific timeframes.
- YTD calculations provide investors with a clear view of investment performance.
- The YTD figures on pay stubs streamline payroll processes. Employers can assess costs, track employee productivity, and make adjustments as needed, ensuring efficient financial management.
- Both MTD and YTD offer comprehensive performance evaluation tools. MTD allows monthly tracking, while YTD provides an annual overview.
Year To Date Example
The following example of YTD regarding the calendar and fiscal year will make the concept easier to understand.
Company A started operating on 6th June 2019, while Company B went into business on 9th September 2019. So let’s assume that both companies have to report their results on 20th January 2020 and that the Year-to-Date is based on the financial year.
- Company A will report its financial performance from 6th June 2019 to 20th January 2020.
- Company B will detail its performance from 9th September to 20th January.
The calendar year for both companies will be:
- Company A - from 6th June 2019 to 1st January 2020
- Company B - from 9th September 2019 to 1st January 2020

How To Calculate YTD for Investment Returns?
The YTD is a period used by analysts, investors, and managers to calculate and compare financial performance.
The analyzed performance can provide information about the change in:
- A company’s sales figures
- Costs
- Investment returns, from equity or debt securities.
The result is multiplied by 100 to achieve a percentage return.
The formula for YTD returns is as follows:
YTD returns = (Value at specified date / Value at the beginning of the period) - 1
where,
- Value at the beginning of the period can refer to the beginning of the calendar or fiscal year, depending on which one is used.
or
YTD return = (Value at specified date - Value at the beginning of the period) / Value at the beginning of the period
Both calculations lead to the same result. The following example will help you understand this better.
Let’s assume an investor invested $15,000 in corporate bonds on 3rd February. Their portfolio grew to $20,000 on 25th July. Plugging the same in the formula above, the YTD return will be 33%:
($20,000 / $15,000) - 1 = 33%
or
($20,000 - $15,000) / $15,000 = 33%
The YTD for investment returns, corporate sales, and costs gives an idea of the entity’s financial position, whether it’s incurring losses or registering profits.
How To Use Year To Date (YTD)?
The metric is easy to use. However, the year basis must be the same to obtain accurate comparing results. For example, if the YTD is based on the financial year of two businesses, the financial year will have to be used as a reference timeframe.
If the calendar year is used, both entities’ starting date will be the beginning of the calendar year, typically 1st January.
It is not impossible to use YTD with the calendar and fiscal years if a firm wants to collect more insight and data.
In this case, the juxtaposition of findings can help inform decisions regarding trading, workforce resources, and supply chain, among others. In addition, the YTD allows us to compare historical data from similar and different periods.
The following example will bring more clarity. For comparison, Company A reported revenue of $37,000 in January and $50,000 in February expenses. The YTD revenue is $87,000 ($50,000 + $37,000).
The YTD can be influenced by the company’s fiscal year since the business can choose the start date of its financial year. In addition, companies with seasonality cycles will report increased sales in specific periods of the year.
The peak sales period is generally considered close to year-end as it sends a positive signal that can influence investors’ decisions and beat analysts’ forecasts and estimates.
What Is Year to Date on a Pay Stub?
The pay stub, also called a check stub, is an HR document that provides detailed information about a worker’s salary.
The total pre-tax wages are broken down into different items that include but are not limited to:
- Taxes
- National insurance contributions
- Holiday pay
- Sick pay
- Relevant bonus or overtime payment
- Loan payments
- Pension contributions
The pay stub also includes the YTD information. For example, an employee who receives their pay stub for July will see the total of their gross wages up to this moment. Gross income represents the monthly revenue before deductions are made.
YTD Net Pay
The net pay is shown on a check stub once all the deductions are made from the gross salary.
The net pay is the amount of money an employee gets after:
- Paying taxes
- Social security
- Pension contributions
The net pay of a worker is the amount of money an employee receives after all deductions have been made from their gross salary. It is specific to individual employees.
On the other hand, a company’s net income is the total profit after deducting all expenses from revenues, and it appears at the bottom of the income statement (IS).
The YTD net pay is presented as an item on the check stub. For example, a pay stub for October will show all the net earnings from the beginning of the calendar year up to this point. The net pay is what an employee receives after all deductions have been made.
Both YTD net and gross earnings are essential for an employer. Having the sum of all workers’ gross wages and net pay enables the employer to manage costs since payroll is usually the highest cost to a company and can account for up to 70% of business revenue, depending on the industry.
The ratio (total payroll/ total revenue) helps to determine:
- Employee productivity
- Cost management
- Affordability of a pay rise or a bonus
- Recruitment decisions, specifically whether to hire part-time or full-time equivalent (FTE) workers
An excellent payroll-to-revenue ratio is considered to be within 15%-30%. However, labor-intensive sectors can have 50% of total revenue payroll expenses.
Month to Date Vs Year to Date
Month-to-date (MTD) is a financial metric that refers to the period from the beginning of the current month to the current date. Typically, MTD doesn’t include the current date as business dealings are incomplete.
For example, on 21st November, the month-to-date runs from 1st November to 20th November. Like YTD, the MTD enables a company to calculate its revenue and costs while it helps investors determine their portfolio returns.
The difference between these two terms is how far back they go. Month-to-date looks back at what has happened in this current month.
At the same time, year-to-date goes back to the beginning of the period, whether 1st January for a calendar year or 6th April for the fiscal year, the latter being the beginning of the financial year in the UK.
Both YTD and MTD are useful for measuring business and investment performance. Year to Date provides an annualized snapshot of performance, which can subsequently be broken into specific monthly data using the MTD function.
In addition, the MTD metric can be more insightful than YTD for measuring payroll costs and revenue for industries with distinct seasonality of operations, such as hospitality and tourism.
Month-to-date enables comparison, just like YTD, and helps managers plan resources and inventories, mitigate seasonal recruitment risk, and ensure efficiencies.
Check out an example of the two concepts in the table below:
| Month | Sales (MTD | Sales (YTD |
|---|---|---|
| January | $10,000 | $10,000 |
| February | $12,000 | $22,000 |
| March | $15,000 | $37,000 |
| April | $11,000 | $48,000 |
| May | $14,000 | $62,000 |
| June | $16,000 | $78,000 |
| July | $18,000 | $96,000 |
| August | $20,000 | $116,000 |
| September | $17,000 | $133,000 |
| October | $19,000 | $152,000 |
| November | $22,000 | $174,000 |
| December | $25,000 | $199,000 |
Here:
- Sales (MTD): Total sales for each specific month
- Sales (YTD): Cumulative sales from January up to that particular month.
This format allows easy comparison of sales performance within a month and the overall progress throughout the year.
We can notice here that, for example, in January, in the Sales (MTD) column, the business made $10,000 in sales up to that point in the month. As the month progresses, this column shows each month's sales figures.
On the other hand, Sales (YTD) indicates the cumulative sales total from January to the respective month. For example, in March, the YTD sales were $37,000, which means the business made a total of $37,000 in sales from January to the end of March.


Free Resources
To continue learning and advancing your career, check out these additional helpful WSO resources:


or Want to Sign up with your social account?