Equity Multiplier
A financial leverage ratio that measures the portion of assets financed by shareholders equity


What is Equity Multiplier?
An equity multiplier is a financial leverage ratio that measures the portion of assets financed by shareholders within a company. It can be found from the total value of a company's equity divided by the total value of shareholders' equity.
This ratio is combined with other ratios, equations, and formulas, such as the DuPont Analysis. A high equity multiple indicates a company is using more debt to finance its assets. A low multiplier means a company is less reliant on debt financing.
A lower ratio is more attractive but does not always signify a better option. An EM is only seen as high or low compared to averages in the industry, historical standards, or company peers.
-
The Equity Multiplier is a financial ratio that reveals the proportion of a company's assets financed by shareholders. Calculated as total assets divided by shareholders' equity, it demonstrates the reliance on debt for funding.
-
Equity Multipliers are crucial for creditors assessing loan risks and investors evaluating a company's financing structure. High ratios indicate debt reliance, while lower ratios imply healthier equity-based financing.
-
A company's Equity Multiplier should be compared to industry norms, historical data, and peer companies. Lower ratios are generally preferable, indicating balanced financing and appealing to creditors and investors.
-
While Equity Multiplier offers a snapshot of financing, it's just one part of financial analysis. Understanding context, debt levels, and other ratios is essential for a comprehensive assessment of a company's financial health.
Where are Equity Multipliers used?
They are used in financial analysis and deal structuring. The primary use for EM’s is mainly for creditors and investors. The ratio can also be found in the DuPont Analysis. This equation uses EM in conjunction with other values to determine the Return on Equity (ROE).
Creditors use this leverage ratio to determine if a company can acquire further debt without increasing risk or hurting the cash flow. Conversely, investors use EM to determine if a company is overleveraged. Overleveraging can result in high debt-servicing charges and a possible lack of future financing options. To understand EM better, it is critical to grasp some basic concepts related to the same. So let us have a look at them:
- Equity is the ownership of various assets that can have liabilities attached. The equity in an item is determined by the value of the asset minus any liabilities attached.
- Debt is an obligation for the debtor to pay back a creditor on terms agreed upon earlier. Debt may be a deferred payment, not requiring immediate repayment. However, the mode of repaying the debt may differ depending on the availability of cash with the company.
- DuPont Analysis was developed by DuPont corporation to review internal sources. This financial assessment tool uses the equity multiple, net profit margin, and asset turnover to find the Return on Equity value.
- Return on Equity provides a measure of net income earned by a firm for its shareholders. The DuPont analysis can determine if there is change over time and how much is due to financial leverages.
The Equation for ROE is as follows:
ROE = Net Profit Margin x Total Assets Turnover x Financial Leverage Ratio
OR

As shown in the equation above, EM and ROE have a direct relationship. Therefore, if the financial leverage ratio is smaller or larger, there will be an immediate effect on the Return on Equity value for smaller or larger.
Understanding the DuPont equation can be very useful when gaining further information about a company's financials. It is important to understand the different inputs and how the EM ratio affects the output.
That said, the EM ratio is still capable of providing a quick look into a company's asset financing structure. Being a much faster and easy formula, it tends to be a ratio computed first before further analysis can be conducted.
How to find the Equity Multiple Value?
The formula for Equity Multiplier is straightforward. Take the total value of assets in a company and divide that value by the total value of shareholder equity. The formula is as follows:
Equity Multiple = Total Assets / Shareholders Equity
where, Shareholders Equity (SE) is the amount of a company financed through shareholder investments.
These values can be found on the company's balance sheet. They can also be found in calculations from a company's annual and quarterly financial reports.
Example:
To explain the EM formula further, we will use Apple Inc. and Verizon Communications Inc. Apple's total assets stood at $305 billion, while the value of the shareholder's equity stood at $130 billion in March of 2016. In this case, the Equity Multiplier ratio is 2.346. For every $305 in assets, shareholder equity was $130. ($305/$130). Apple finances 42.63% of its assets with Shareholders' Equity, and 57.38% is funded through debt.
At the same time, Verizon's total assets were $245 billion, while the value of shareholder equity stood at $19 billion. As a result, the EM ratio for Verizon is 12.895 ($245/$19), and it financed 92.24% of its assets with a form of debt. Verizon seems to have a majority of its assets financed through debt which can signify high debt service charges. Gaining additional financing from creditors could be complicated with such leverage as well.
On the other hand, Apple has a more manageable asset financing structure. This makes Apple more appealing to creditors for additional future loans. Apple's minimal debt asset financing structure is more attractive to creditors who will be willing to provide further debt and loans. Investors are also more likely to invest because of the low debt financing and financing expansion opportunities.
Investors also gain confidence in such companies. This is because the cash flows of a company will be relatively healthier as debt-servicing charges will be minimized. The same cash can then be used for various purposes.
What does Equity Multiplier tell us?
Is a leverage function that measures a portion of a company's assets financed through equity/debt. The higher the value, the more debt a company is financing assets with.
A lower number indicates a company is less reliant on debt. A low leverage value is deemed to indicate a healthy company due to decreased debt financing and service fees.
No EM value alone can determine the health or direction of a company. This value must only be compared to historical standards, industry averages, or company peers.
Apple's ratio of 2.346 indicates that the company incurs less debt servicing fees while enjoying less leverage. On the other hand, Verizon has a ratio of 12.895, showing the company is heavily reliant on debt financing and other liabilities.
So it is safe to assume that Verizon's cash flows may be more strained than Apple's solely because of their high debt levels. However, one must note that high debt levels are not necessarily harmful.
A company may take on debt for a variety of reasons other than a lack of financing options:
-
Having healthy debt on a company's balance sheet gives the business certain tax exemptions.
-
The company may have powerful cash flows that can support such high debt levels.
-
The business may be procuring debt at very low-interest rates in anticipation of rate hikes. This is done when companies can see a specific use of cash in the future and therefore procure the debt at lower rates.
These values should only be compared to similar companies in the industry or historical data. These values can vary greatly depending on the industry, so an apples to oranges comparison will not be a good judgment for two different companies.

How to use Equity Multipliers?
When looking at a company's financials, it is vital to understand how the firm finances its current and future assets.
It is essential to determine if a company relies on debt to finance its assets or if it utilizes shareholders' equity. It is common to find companies on both sides of the chart, though most believe a lower-leveraged company to be a better option.
Creditors
Equity multipliers are ratios that banks and creditors look at when deciding to provide loans to a company. This leverage ratio is not the only tool examined but is essential for companies seeking new loans.
If a company has an enormous debt to assets resulting in a high leverage ratio, banks will be less willing to provide additional loans. The company already has high debt service charges and will need to increase cash flows to pay increased debt charges.\
Financial institutions may also provide unfavorable credit arrangements in such cases. On the other hand, creditors will be more likely to extend funding or provide better credit terms if a company has a low debt to asset ratio resulting in a low ratio.
A low equity ratio indicates reduced risk for creditors due to a company's lack of debt burden and
Investors
Investors look at a range of data and ratios when analyzing investment opportunities in companies.t. Using the EM ratio is an indicator of whether a company is using large amounts of debt or shareholder equity.
As an investor, this value can be good or bad depending on what the investor is trying to attain.
Investing in a company with a low EM ratio is usually safer. This is due to lower debt obligations in the business and a healthier financing structure.
Investing in a company with a high EM ratio requires more emphasis on cash flows. This is because revenue will need to increase to satisfy increasing debt service charges.
Example of Equity Multiplier Analysis
The EM ratio can be found either in a completed form or by inputting the formula with a company's given financial data. This data can be found easily from a simple search or the company's financial reports (declared in quarterly or annual results).
Items such as the annual 10-K and the quart 10-Q are filings every public company generates. These filings include a vast amount of financial information in which the inputs for EM can be found.
Below are the balance sheets from HP and Tesla found in their most recent 10-K filings. The balance sheet provides us with the shareholder equity value and a value for total assets.
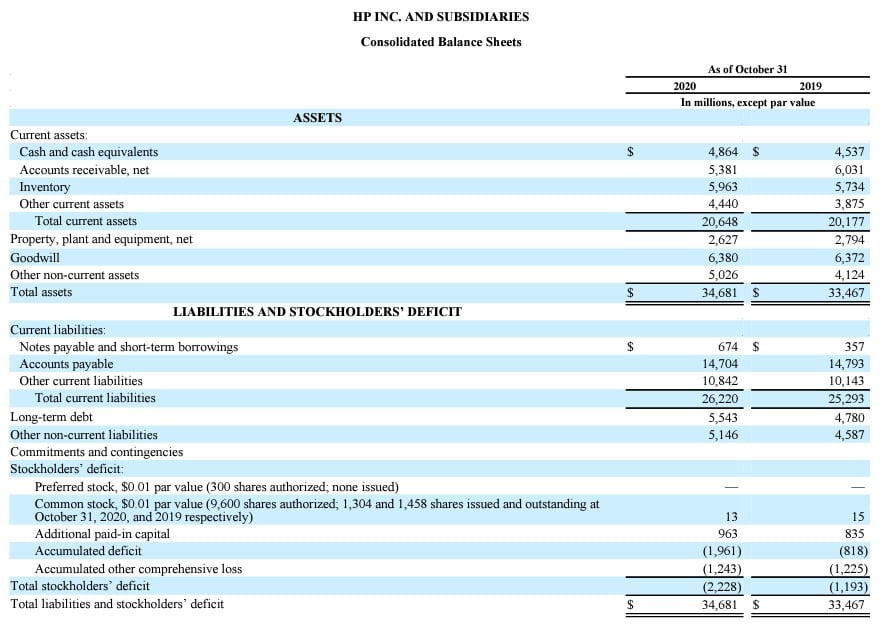
HP Inc's balance sheet for 2020 states that total assets were $34,681, and its total shareholder equity was worth $2,228. Inputting these values into the EM equation provides HP with a leverage ratio of 15.56.
HP finances only 6.4% of its assets from stockholder equity and utilizes debt to finance the remaining 93.6%. As a result, HP has a very high leverage ratio and might have seemed over-leveraged in 2020.
An EM value of 15.56 is very high among all industries. However, this high value might reduce a company's ability to secure future funding and loans. This is because Honda is believed to already have large debts and high debt service charges.
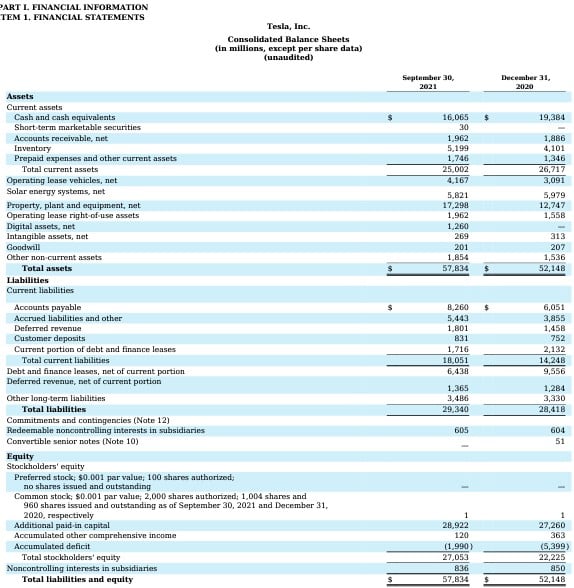
Tesla’s balance sheet for 2020 shows total assets at $52,148 (millions) and total stockholders equity at $22,225 (millions). Putting these values into the EM equation provides Tesla with an Equity Multiple of 2.34.
This ratio tells us that Tesla's assets are worth 2.34 times as much as the total stockholder equity. Tesla is financing 42.6% of its assets through stockholder equity and 57.4% with debt.
A ratio close to 2.5 is a typical EM value that will often gain approval from creditors and investors when looking for future loans. This value must only be compared to historical values, industry averages, and peer insight.
Tesla's 2.34 ratio cannot be compared to a lower or higher ratio of a company that operates within a different sector. However, Tesla's value can be compared against similar companies like Rivian or Lucid Motors.
Special Considerations
The Equity Multiplier provides investors and creditors an insight into how much debt a company is using to finance its assets. This value can range from one to infinity.
A low equity multiplier is seen as a more appealing value. A low value indicates a company is using less debt to finance assets. A low EM value can also signal a company that cannot secure debt in the first place.
A high EM value indicates a company is using a more significant portion of the debt to finance its assets. When we rate the value as "high," this is only compared to similar comparables, historical data, and industry peers.
High ratios are not always bad. They can sometimes be volatile to nonrecurring events or a company's ability to secure large amounts of assets at a very good cost.
Equity multiples and other financial ratios are great tools to take a quick look into a company. These ratios are not encompassing a company's health and capital structure, though.
It is essential to analyze and compute various ratios and tools to see a company's financial health and nature truly. Ratios like an equity multiple are snapshots into a much larger corporate image.
Equity Multiplier FAQs

This means that a company's assets are worth twice as much as the total shareholders' equity. The higher this value, the more leveraged, or debt-heavy, the company is.
Equity Multiple = Total Assets / Total Shareholder Equity. Total Assets and Shareholder's Equity can be found on 10-K and 10-Q filings.
A lower value is typically better. Though the EM ratio is a snapshot of a company, lower ratios indicate a reduced reliance on debt to finance its assets.

Researched and authored by Colt DiGiovanni | LinkedIn
Free Resources
To continue learning and advancing your career, check out these additional helpful WSO resources:


or Want to Sign up with your social account?