Financial Leverage
Refers to the use of debt to finance an asset raised with the intention of amplifying the returns


What is Financial Leverage?
Financial leverage refers to the use of debt to finance an asset raised with the intention of amplifying the returns from an investment or project.
It is also called leverage or trading on equity. Investors also use debt to multiply their purchasing power. They take advantage of leverage by using instruments like options, futures, and margin accounts.
Hedge funds can also leverage their assets by financing their portfolio with the cash proceeds of short-selling. If they are hesitant to use these instruments, then they can take its benefits indirectly by investing in companies that usually use debt to finance their operations.
As financial leverage increases, the cost of funds declines because of the increased use of cheaper debt, but the financial risk also increases. Generally, the lender decides the limit of risk, i.e., the limit of leverage he or she is willing to take.
-
Financial leverage involves using debt to finance assets, aiming to amplify returns on investments or projects. It can be employed by companies and investors to increase purchasing power and enhance returns but comes with increased financial risk.
-
Highly leveraged companies have more debt than equity, leading to reduced capital costs but increased financial risk. The cost of debt is generally lower than equity, and interest payments are tax-deductible, contributing to potential profit enhancement.
-
Evaluating the impact of financial leverage on profitability can be done through EBIT-EPS analysis. This assesses the relationship between Earnings Before Interest and Taxes (EBIT) and Earnings Per Share (EPS), helping determine the optimal capital structure for maximizing shareholder wealth.
-
Financial leverage is measured using various leverage ratios, including Debt to Equity Ratio, Debt to EBITDA Ratio, and Interest Coverage Ratio. These ratios provide insights into a company's financial health, risk, and ability to meet debt obligations.
How Does Financial Leverage Work?
If a company is “highly leveraged,” it means that it has more debt than equity. If the loan is backed by assets, then the lender uses assets as collateral until the loan is repaid. In the case of a cash flow loan, the creditworthiness of the company is used to back the loan.
Debt reduces the cost of capital and makes the capital structure more optimal. But the risk is increased due to an increase in fixed payment obligations in the form of principal and interest. Thus, a strong cash flow position is required to take advantage.
Trading on equity increases the profit earned by the equity shareholders due to the presence of fixed financial charges like interest. It raises its earnings per share by making use of fixed-cost securities or debt.
The cost of debt is lower than the cost of equity for a company, as the lender's risk is lower than the risk of the shareholder. Also, interest paid on debt is a tax-deductible expense, whereas dividends are paid out of after-tax profits.
One way of knowing the impact of financial leverage on the profitability of a business is through the analysis of Earnings before Interest and Taxes (EBIT) and Earnings Per Share (EPS), commonly known as EBIT-EPS analysis.
Using more debt is not always profitable. EPS increases only when the Return on Investment (ROI) is greater than the cost of debt.
If the return on investment is less than the cost of debt, then earnings per share will fall with the increased use of debt, and hence equity shareholders will lose by the use of more debt in the capital structure. Thus, it will be a situation of unfavorable financial leverage.
However, reckless use of trading on equity is not advised even when the return on investment is greater than the cost of debt. An increase in debt may enhance the earnings per share but also raise the financial risk. So, a risk-return combination must be chosen that maximizes shareholders’ wealth. The debt-equity mix that achieves it is the optimal capital structure.
Financial Leverage Example
Let us see how the increased use of debt increases the profits for the firm using EBIT-EPS analysis.
Suppose a company, A Ltd., wants to raise $3,000,000 for investment purposes.
It can raise $3 million by any of the three options given, i.e.-
when funds are raised solely through equity:
1. Debt = Nil and equity = $3,000,000
when some part is raised through debt and the major part through equity:
2. Debt = $1,000,000 and equity = $2,000,000
when the major part is raised through debt and the balance through equity:
3. Debt = $2,000,000 and equity = $1,000,000.
Additional information:
- The face value of equity shares is $10 each.
- The interest rate on debt is 10%, and the tax rate is 30%.
- The Earnings before Interest and Tax (EBIT) are $400,000.
The EBIT-EPS analysis is shown in the given picture.
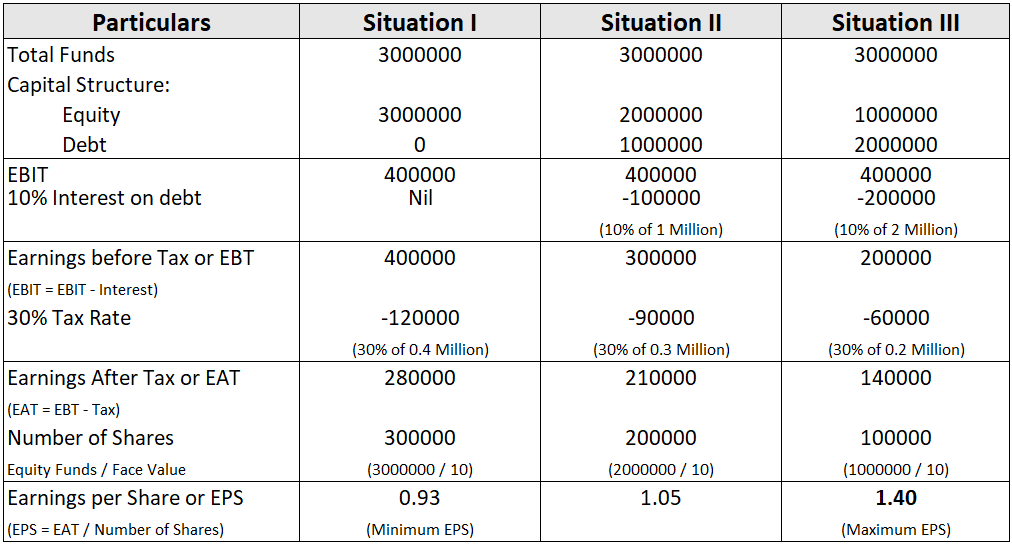
Out of these three situations, situation III seems to be the best as it gives the maximum EPS of $1.40. In this situation, the company has used the maximum debt, and the outcome is positive.
EPS is the minimum in situation I, where there is no debt content. Hence, the conclusion is that the use of more debt increases the returns for equity shareholders.
The Return on Investment in this case is:

The ROI is 13.33%, whereas the cost of debt is just 10%.
As Return on Investment > Cost of Debt, EPS will always rise with an increase in debt.
With the higher use of debt, this difference between ROI and the cost of debt increases the earnings per share and creates a situation of favorable financial leverage.
In the same example, let us assume that the EBIT is $200,000 instead of $400,000.
Therefore,

The cost of debt is 10%, and the Return on Investment is only 6.67%.
As Return on Investment < Cost of Debt, Earnings per Share should fall with an increase in debt.
The analysis is shown in the picture. Note the changes carefully.

Earnings per share are NIL in situation III, which has the maximum debt, and Earning per share is maximum in situation I, where there is no debt content.
Thus, in such cases where the return on investment is less than the cost of debt, the use of debt reduces the earnings per share.
How is Financial Leverage Measured?
It is measured using leverage ratios, which determine a company's financial health and strength.
They measure the proportion of debt in the capital structure and the company’s ability to pay it off.
1. Debt to Equity Ratio
The debt to equity ratio represents the proportion of debt and equity in the company’s balance sheet.
It is the most common and widely used leverage ratio.
A debt to equity ratio of 2:1 is considered as optimal, but this varies from company to company.
It also shows the level of risk to the company’s investors.
Debt to Equity Ratio = Total Debt/ Total Equity
Total debt includes both current (obligations that the firm needs to pay off within one year) and non-current (obligations that the firm needs to pay off after one year) liabilities.
Total equity includes shareholders’ funds (amount invested by the shareholders of the company) and retained earnings (amount of profits owned by the firm).
2. Debt to Capital Ratio
The debt-to-capital ratio is the ratio of a company’s total debt to its total capital.
Debt to Capital Ratio = Total Debt/ (Total Debt + Shareholder's Equity)
It measures the company’s total debt as a percentage of its total capitalization.
Debt includes both current and non-current interest-bearing debt.
Capital includes both interest-bearing debt and shareholders’ equity.
A high ratio indicates that the company is highly leveraged.
3. Debt to EBITDA Ratio
This ratio measures the amount of income available to pay off debt before covering interest, taxes, depreciation, and amortization expenses.
Debt to EBITDA Ratio = Total Debt/ EBITDA
EBITDA refers to Earnings before Interest, Taxes, Depreciation, and Amortization.
Debt includes both short-term and long-term obligations of the firm.
A ratio of less than 3 is considered acceptable, and ratios higher than this indicate a company that may be financially distressed in the future.
4. Interest Coverage Ratio
The interest coverage ratio measures how many times the interest is covered by the earnings of the firm.
Interest Coverage Ratio = EBIT/ Interest Expenses
EBIT refers to Earnings before Interest and Taxes.
This ratio analyzes how well a company can fulfill its interest obligations.
A minimum ratio of 3.0 should be maintained by the companies, but a high ratio is considered better.
However, if the ratio is too high, then the company might be missing opportunities to increase its earnings through financial leverage.
5. Consumer Leverage Ratio
The consumer leverage ratio represents the amount of debt an average American has relative to their disposable income.
Consumer Leverage Ratio = Total household Debt/ Disposable Personal Income
The total household debt is reported by the Federal Reserve System, while the disposable personal income is reported by the US Department of Commerce, Bureau of Economic Analysis.
Some economists believe that a rapid increase in this ratio is a major contributing factor in driving the growth in corporate earnings, while others blame it as a major cause of the great recession.
6. Debt to Capitalization Ratio
This ratio measures the total amount of debt against a firm’s total capitalization as a percentage.
Debt to Capitalization Ratio = (Short Term Debt + Long Term Debt)/ (Short Term Debt + Long Term Debt + Shareholder's Equity)
It includes operating leases in debt along with current and non-current debt and shareholders’ equity, which includes both common and preferred shares.
A high ratio indicates higher risk, and the firm should ensure that it has enough cash flows to manage interest and principal payments to prevent bankruptcy.
7. Degree of Financial Leverage
The degree of financial leverage assesses the sensitivity of a firm’s earnings per share relative to the change in its operating profit, also known as Earnings Before Interest and Tax (EBIT), after making relevant changes to its capital structure.
Degree of Financial Leverage = % Change in Earnings Per Share/ % Change in Earnings Before Interest and Tax
OR
Degree of Financial Leverage = Earnings Before Interest and Tax/ (Earnings Before Interest and Tax - Interest)
The higher the ratio, the more volatile a company's earnings will be. It is good when the earnings are increasing, but can be an issue when they are falling.
8. Equity Multiplier
The equity multiplier shows the proportion of a company’s assets financed by its equity.
Equity Multiplier = Total Assets/ Total Equity
Where,
Total Assets = Total Debt + Shareholder's Equity
A high ratio indicates a high dependence on debt, while a low ratio represents a low dependence.
This ratio is used by investors to assess the riskiness of a business.
9. Fixed Charge Coverage Ratio
The fixed charge coverage ratio measures the times the company's fixed charges, like interest, rent, insurance premiums, etc., are covered by the business's earnings.
Fixed Charge Coverage Ratio = (Earnings Before Interest and Taxes + Fixed Charges Before Tax)/ (Fixed Charges Before Tax + Interest)
A low ratio is considered risky by the lenders to the business.
Therefore, the higher the ratio, the better, as it indicates financial strength and a strong cash flow.
10. Tier 1 Leverage Ratio
This ratio shows the relationship between a bank’s core capital and its total assets.
Tier 1 Leverage Ratio = (Tier 1 Capital/ Consolidated Assets) * 100
Tier 1 capital is taken as these assets are highly liquid and can be easily used during a financial crisis.
Thus, this ratio measures a bank’s short-term financial health. In addition, it assesses how leveraged a bank is. A ratio of 5% and above shows a strong financial position for the bank.
Risks of Financial Leverage
It may increase earnings for a company, but it can also increase losses. Losses may occur due to the inability of the firm to pay interest charges due to insufficient returns from the assets. The following are some of the risks of financial leverage:
1. Volatility of Stock Price
A large amount of leverage causes huge swings in profits, which increases the volatility of a company's share price.
Due to this, the proper accounting of stock options owned by the company’s employees is disrupted since they create a higher compensation expense than less volatile shares.
Increased stock prices lead to higher interest for the shareholders.
2. Bankruptcy
In a cyclical business or in businesses where there are low barriers to entry, the revenues and profits fluctuate more frequently which increases the chances of bankruptcy if the firm is not able to meet its rising debt and interest obligations.
3. Reduced Access to More Debts
Lenders assess the firm’s financial leverage before lending.
If the company has a high debt-to-equity ratio, then lenders will hesitate to advance further funds due to a high chance of default.
Even if they do advance, then it will be at a higher rate of interest to offset the higher risk of default.
Advantages and Disadvantages of Financial Leverage
Advantages
- As proved earlier through an example, trading on equity increases the profit earned by the equity shareholders due to the presence of fixed financial charges like interest. It raises its earnings per share by making use of fixed-cost securities or debt.
- The cost of debt is lower than the cost of equity for a company, as the lender's risk is lower than the risk of the shareholder.
- Also, interest paid on debt is a tax-deductible expense, whereas dividends are paid out of after-tax profits.
- The borrower is able to make a huge investment due to extra funds.
Disadvantages
- Leverage magnifies gains, but the same is true with losses too.
- If the returns on investment are not able to even cover its costs, then the losses are much more than they would have been without leverage. In this case, the shareholder value will also fall significantly.
- A highly leveraged company also presents greater operational risk and can even lead to bankruptcy.
- If the investment is riskier or the company is highly leveraged, then the lenders also charge a higher rate of interest.
- The financial crisis of 2007-2008 was partly blamed as a result of excessive leverage. For example, Lehman Brothers were leveraged over 30 times before they were declared bankrupt.
Operating Leverage
Operating leverage measures the sensitivity of a company's operating income to its sales. It is the ratio of fixed costs to variable costs of a company in a specific period.
Fixed costs are those costs that don’t change with a change in the number of goods produced, like rent, depreciation, interest charges, etc. Variable costs are those costs that change with a change in the number of goods produced, like the cost of raw materials, electricity costs, etc. They are directly related to output. A business with low variable and high fixed costs is considered to be highly leveraged, which is common in manufacturing industries as they need a large number of machinery to produce goods.
In the case of high operating leverage, if the sales are high, then companies' benefit magnifies with each additional sale. However, if the sales are low, profits can be maintained only if the firm has low operating leverage.
Operating leverage is used to set the break-even point for the company, i.e., the point at which the goods should be sold to cover all the costs and earn profits.


or Want to Sign up with your social account?