Quantitative Analysis
A methodology employed in financial research that utilizes measurable data such as revenues, market shares, and wages to decipher business performance.


What is Quantitative Analysis?
Quantitative Analysis is a methodology employed in financial research that utilizes measurable data such as revenues, market shares, and wages to decipher the performance of businesses.
Traditionally, decisions leaned on the company’s owners' experience and gut feelings. But now, with the advent of data technology, quantitative analysis is considered better for making smarter and well-informed business decisions.
Quantitative analysis also dives into financial markets using math and statistics to guide better investment moves. Quantitative analysts, known as "quants," scrutinize past stock prices and earnings reports to predict where the market might head.
Unlike peering into management or industry conditions, the quantitative approach revolves around number-crunching and intricate calculations to gain insights. It's a potent tool in today's data-rich, tech-advanced markets, offering a sharp view of finance landscapes.
Quantitative analysis's numerical output should blend with the deeper understanding and shades of meaning that qualitative analysis brings.
One can blend the numerical output generated from the quantitative analysis with the in-depth understanding that qualitative analysis brings, thereby bridging the gap between raw data and nuanced understanding in financial decision-making.
- Quantitative analysis is a method in financial research that harnesses measurable data like revenues, market shares, and wages to decode how businesses perform.
- Quantitative analysis also dives into financial markets using math and statistics to guide better investment moves. Quantitative analysts scrutinize past stock prices and earnings reports to predict where the market might head.
- Some key techniques used in quantitative analysis are regression analysis, linear programming, and data mining.
- Key applications of quantitative analysis include production planning, marketing strategy, finance and accounting, inventory management, and algorithmic trading.
Quantitative Analysis Techniques
Quantitative analysis, pivotal for financial insights, delves into numerical scenarios. Its techniques gauge performance, assess financial tools, and predict outcomes.
Some key techniques used in quantitative analysis are regression analysis, linear programming, and data mining.
Consider these techniques as a digital compass navigating the complexities of financial landscapes. In this realm, numbers aren't just digits; they're gateways to insights, predictions, and informed decisions.
These techniques play vital roles across central banking, algorithmic trading, hedge fund management, and investment banking. Quants harness various skills—from programming to statistics, calculus, and linear algebra—to wield these analytical approaches effectively.
The skills of a quantitative analyst become a toolkit, unlocking the potential within numerical data and making it a vital force in the dynamic world of finance.
Regression Analysis
Regression analysis is a versatile tool for business owners, statisticians, and economists. It's about using statistical equations to predict or estimate how one variable impacts another.
For instance, it reveals how interest rates sway consumer’s behavior in asset investment. Similarly, it uncovers the influence of location and size (in sq. ft) on housing prices.
Let's explore how it aids business owners in making informed strategic decisions.
For example, Mr. Brook wants to know how advertising expenses impact the net profits of his business. He has data from the previous year for the monthly advertising expenses and the business's corresponding profits.
| Advertising Expenses (in dollars) | Business Profits (in dollars) |
|---|---|
| 2000 | 4500 |
| 4000 | 7500 |
| 6000 | 10500 |
| 3000 | 6500 |
| 5000 | 8500 |
| 2500 | 5000 |
| 4200 | 8000 |
| 5500 | 9500 |
| 3300 | 7000 |
| 4700 | 9000 |
| 3800 | 8500 |
| 6200 | 11000 |
Using this data, he wants to know what the monthly profits would be for a certain amount of advertising expenses and how he can optimize the budget for advertising. We can use regression analysis and set up a model to help him with this.
Graphically, advertising expenses are plotted on the x-axis and business profits on the y-axis; the best-fit line represents the linear relationship derived from the provided data points.
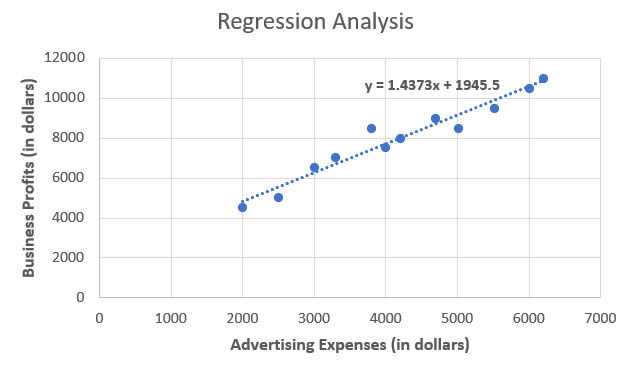
A linear regression analysis can be conducted using statistical software or tools. For a simple linear regression model, the resulting regression equation for the above data is:
Profit = 1.4373 × Advertising Expenses + 1945.50
The equation suggests that for every dollar increase in advertising expenses, the expected increase in business profits is approximately $1.44.
Using the above relationship, Mr. Brook can estimate the profits and gain valuable insights as follows:
- Profit Projection: He can use this model to forecast profits based on different advertising budgets. This model predicts that increasing advertising spending might lead to higher expected profits.
- Optimizing Budget Allocation: This analysis aids in optimizing advertising spending by estimating the potential impact on profits. It provides a framework for allocating resources efficiently to maximize returns within a given budget.
Considerations and Real-world Application:
While the model provides insights, actual business scenarios are multifaceted. External factors like market fluctuations, consumer behavior, competition, and product quality can significantly impact profits beyond advertising expenses.
Therefore, while this analysis offers a valuable framework for estimating the impact of advertising expenses on profits, it's vital to complement it with broader business intelligence and assessment to make informed decisions that align with the dynamic business environment.
Linear Programming
Linear programming is a powerful tool for financial analysts and businesses facing resource constraints. It is useful when a company wants to optimize its production to maximize profits while working within limitations like available labor and machinery.
It not only aids in profit maximization but also offers insights into resource allocation, cost reduction, and decision-making. It's a realistic approach for businesses navigating the intricacies of resource scarcity and operational efficiency.
In this context, linear programming involves crafting a mathematical model to find the best outcome under certain constraints.
For example, a company produces two products, A and B. The labor and machine hours required to produce single units of A and B and their profits are shown below.
| Product | Labor Hours | Machine Hours | Profit per Unit |
|---|---|---|---|
| A | 3 | 2 | $500 |
| B | 2 | 4 | $800 |
However, there are constraints. The company can only use a maximum of 200 labor hours and 150 machine hours in a month’s production. The objective is to optimize the monthly production for maximum profits under the above constraints.
Now, with linear programming, an equation is formulated to maximize the profit (let x be the units of A and y be the units of B):
Total Profit = 500x + 800y
Subject to the constraints:
3x + 2y <= 200
2x + 4y <= 150
Solving this system reveals the optimal solution, determining the quantity of products A and B to produce for maximum profit within the given constraints. The feasible region where these constraints intersect forms the boundaries for optimal solutions.
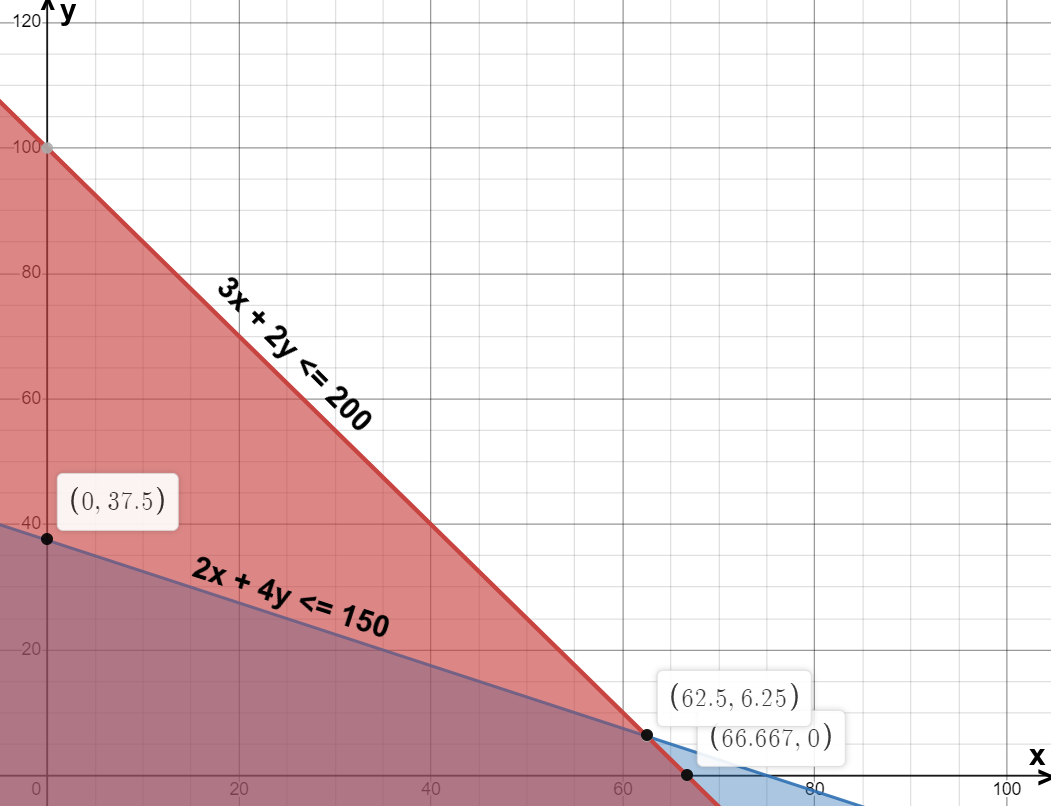
The boundary points where these constraints intersect are (0, 37.5), (62.5, 6.25), and (66.67, 0).
Substitute these points in the total profit equation above and choose the point with the maximum profit value.
Upon calculation, we can say that the points (62.5, 6.25) yield the maximum profit value. Thus, the company should produce 62 units of A and 6 units of B to maximize the total profit.
If you still have doubts regarding the linear programming calculations, here is a detailed video explaining the concept and examples
Data Mining
Data mining, a fusion of computer programming and statistical methods, is gaining momentum as the volume of available data expands.
Its essence lies in unraveling patterns and correlations concealed within vast datasets. This is more than just crunching numbers; it's about unveiling actionable insights from the data labyrinth.
Data mining is a modern-day detective sifting through extensive data sets to uncover hidden gems of information. Imagine it as a treasure hunt in the digital world, where the "treasure" is valuable insights waiting to be discovered.
Data mining techniques range from clustering and classification to association and regression. These tools become the compass for businesses navigating the sea of information.
Consider a financial scenario where a company wants to understand customer behavior. Data mining can dive into customer transactions, preferences, and interactions, revealing patterns that guide strategic marketing or product development.
As businesses evolve, so does the need for effective data utilization. Data mining stands at the forefront, bridging the gap between raw information and meaningful insights.
The goal is to transform raw data into actionable intelligence, fostering informed decisions and gaining a competitive edge. It's a dynamic process, adapting to the evolving landscape of data and providing businesses with a roadmap to navigate the complexities of the information era.
Applications of Quantitative Analysis
Quantitative analysis is a versatile toolkit that underpins critical business decisions. Its applications span across various sectors, supporting businesses in optimizing resource allocation, refining strategies, and navigating the complexities of the modern market landscape.
Here are some key applications of quantitative analysis techniques in the business sector:
- Production Planning: Quantitative analysis is pivotal in making informed decisions about new production facilities. It assesses proposals for costs, timing, and location, aiding effective product planning and scheduling to meet customer demands while maximizing profits.
- Marketing Strategy: For businesses, setting a marketing budget without clear objectives can be perplexing. Quantitative methods empower marketers to establish budgets and allocate resources based on campaign data, ensuring strategic and data-driven decision-making.
- Finance and Accounting: Quantitative analysis plays a critical role in finance and accounting departments. It utilizes quantitative data and methods, such as discounted cash flow models, to estimate investment value. This aids in financial decision-making and investment planning.
- Purchase and Inventory Management: Quantitative techniques guide businesses on material purchase quantities, optimal inventory levels, and shipping and storing finished goods costs. This facilitates efficient inventory management and cost control strategies.
- Algorithmic Trading: Quantitative analysis fuels algorithmic trading by harnessing data to drive trade execution. Sophisticated algorithms process market data, swiftly executing trades adhering to predefined rules and indicators. This method enhances both speed and efficiency in trading.
Conclusion
Quantitative analysis, rooted in mathematical and statistical techniques, revolutionizes business decision-making.
In the past, gut instincts and owner’s experience shaped decisions, but now, quantitative methods predict trends, optimize resource allocation, and streamline project management.
The applications of quantitative methods extend across various domains, offering predictive insights that shape decision-making.
From foreseeing trends to efficiently allocating resources and managing projects, quantitative analysis empowers businesses with a structured and informed approach.
Quantitative techniques play a pivotal role in making investment decisions. They guide organizations in determining the optimal assets to invest in and the opportune moments to do so.
This strategic use of quantitative analysis enhances investment decision-making, contributing to more effective portfolio management.
Quantitative analysis is more than a mathematical approach; it's a transformative force bridging the gap between raw data and actionable intelligence.
As businesses navigate the complexities in finance, quantitative analysis remains an indispensable ally, equipping decision-makers with the tools needed to thrive in an era defined by data-driven insights.

Free Resources
To continue learning and advancing your career, check out these additional helpful WSO resources:


or Want to Sign up with your social account?